AutomaticData ADP full analysis,charts,indicators,moving averages,SMA,DMA,EMA,ADX,MACD,RSIAutomatic Data ADP WideScreen charts, DMA,SMA,EMA technical analysis, forecast prediction, by indicators ADX,MACD,RSI,CCI USA stock exchange
operates under Technology sector & deals in EDP Services
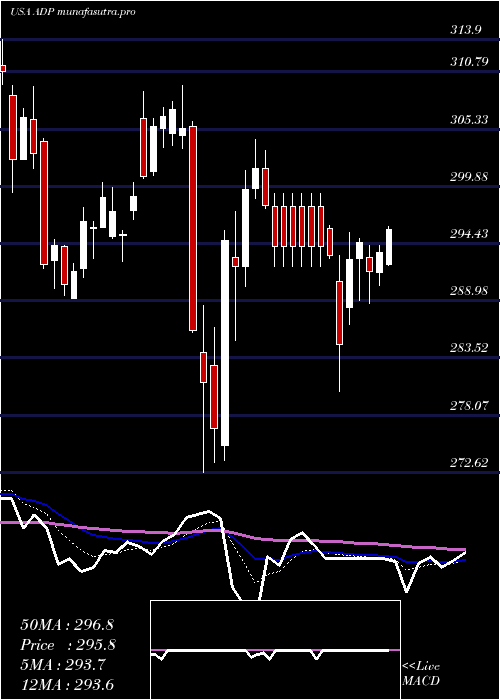
Daily price and charts and targets AutomaticData Strong Daily Stock price targets for AutomaticData ADP are 282.11 and 284.67 | Daily Target 1 | 280.09 | | Daily Target 2 | 281.56 | | Daily Target 3 | 282.65 | | Daily Target 4 | 284.12 | | Daily Target 5 | 285.21 |
Daily price and volume Automatic Data
| Date |
Closing |
Open |
Range |
Volume |
Mon 20 October 2025 |
283.03 (0.63%) |
281.61 |
281.18 - 283.74 |
0.8879 times |
Fri 17 October 2025 |
281.27 (0.4%) |
280.98 |
280.00 - 282.90 |
0.8277 times |
Thu 16 October 2025 |
280.16 (-1.43%) |
284.26 |
279.42 - 284.48 |
0.9506 times |
Wed 15 October 2025 |
284.21 (-0.6%) |
286.70 |
283.01 - 287.69 |
0.9977 times |
Tue 14 October 2025 |
285.92 (0.55%) |
283.66 |
283.62 - 286.80 |
0.8267 times |
Mon 13 October 2025 |
284.35 (-0.29%) |
285.21 |
282.89 - 286.83 |
1.2989 times |
Fri 10 October 2025 |
285.19 (-0.24%) |
286.85 |
284.65 - 287.80 |
1.7288 times |
Thu 09 October 2025 |
285.89 (-1.65%) |
290.44 |
285.41 - 291.34 |
0.853 times |
Wed 08 October 2025 |
290.70 (-0.76%) |
292.56 |
289.82 - 292.80 |
0.897 times |
Tue 07 October 2025 |
292.94 (0.82%) |
291.68 |
290.45 - 293.51 |
0.7319 times |
Mon 06 October 2025 |
290.55 (-0.26%) |
291.50 |
288.49 - 291.95 |
1.0837 times |
Weekly price and charts AutomaticData Strong weekly Stock price targets for AutomaticData ADP are 282.11 and 284.67 | Weekly Target 1 | 280.09 | | Weekly Target 2 | 281.56 | | Weekly Target 3 | 282.65 | | Weekly Target 4 | 284.12 | | Weekly Target 5 | 285.21 |
Weekly price and volumes for Automatic Data
| Date |
Closing |
Open |
Range |
Volume |
Mon 20 October 2025 |
283.03 (0.63%) |
281.61 |
281.18 - 283.74 |
0.1884 times |
Fri 17 October 2025 |
281.27 (-1.37%) |
285.21 |
279.42 - 287.69 |
1.0403 times |
Fri 10 October 2025 |
285.19 (-2.1%) |
291.50 |
284.65 - 293.51 |
1.1237 times |
Fri 03 October 2025 |
291.31 (-0.08%) |
292.50 |
285.03 - 294.35 |
1.3537 times |
Fri 26 September 2025 |
291.54 (-0.16%) |
289.46 |
287.31 - 294.46 |
1.5025 times |
Fri 19 September 2025 |
292.00 (-0.51%) |
293.57 |
282.27 - 294.93 |
1.674 times |
Fri 12 September 2025 |
293.50 (-0.83%) |
296.58 |
290.38 - 299.22 |
1.0684 times |
Fri 05 September 2025 |
295.97 (-2.66%) |
301.64 |
293.95 - 302.68 |
0.9078 times |
Fri 29 August 2025 |
304.05 (0%) |
302.65 |
302.65 - 305.31 |
0.1494 times |
Fri 29 August 2025 |
304.05 (-1.27%) |
306.71 |
301.75 - 307.80 |
0.9918 times |
Fri 22 August 2025 |
307.95 (2.04%) |
302.02 |
301.10 - 310.08 |
0.8687 times |
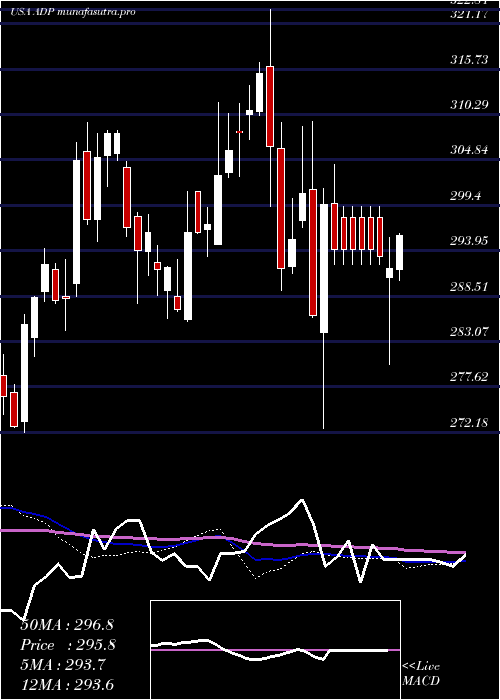
Monthly price and charts AutomaticData Strong monthly Stock price targets for AutomaticData ADP are 274.12 and 288.34 | Monthly Target 1 | 271.14 | | Monthly Target 2 | 277.09 | | Monthly Target 3 | 285.36333333333 | | Monthly Target 4 | 291.31 | | Monthly Target 5 | 299.58 |
Monthly price and volumes Automatic Data
| Date |
Closing |
Open |
Range |
Volume |
Mon 20 October 2025 |
283.03 (-3.57%) |
292.48 |
279.42 - 293.64 |
0.6458 times |
Tue 30 September 2025 |
293.50 (-3.47%) |
301.64 |
282.27 - 302.68 |
1.2682 times |
Fri 29 August 2025 |
304.05 (-1.76%) |
308.00 |
298.66 - 310.08 |
0.877 times |
Thu 31 July 2025 |
309.50 (0.36%) |
308.18 |
296.46 - 315.98 |
0.9168 times |
Mon 30 June 2025 |
308.40 (-5.26%) |
322.80 |
296.75 - 329.93 |
1.0332 times |
Fri 30 May 2025 |
325.53 (8.29%) |
299.21 |
293.73 - 327.99 |
0.8847 times |
Wed 30 April 2025 |
300.60 (-1.61%) |
305.38 |
272.62 - 309.50 |
1.2873 times |
Mon 31 March 2025 |
305.53 (-3.06%) |
316.01 |
289.20 - 322.84 |
1.1077 times |
Fri 28 February 2025 |
315.18 (4.02%) |
303.30 |
302.72 - 316.46 |
0.85 times |
Fri 31 January 2025 |
303.01 (3.51%) |
293.83 |
285.48 - 311.67 |
1.1293 times |
Tue 31 December 2024 |
292.73 (-4.95%) |
303.94 |
287.63 - 304.70 |
0.7561 times |

DMA SMA EMA moving averages of Automatic Data ADP
DMA (daily moving average) of Automatic Data ADP
| DMA period | DMA value | | 5 day DMA | 282.92 | | 12 day DMA | 286.29 | | 20 day DMA | 288.22 | | 35 day DMA | 290.99 | | 50 day DMA | 294.91 | | 100 day DMA | 302.04 | | 150 day DMA | 301.91 | | 200 day DMA | 301.96 | EMA (exponential moving average) of Automatic Data ADP
| EMA period | EMA current | EMA prev | EMA prev2 | | 5 day EMA | 283.02 | 283.02 | 283.89 | | 12 day EMA | 285.43 | 285.87 | 286.71 | | 20 day EMA | 287.57 | 288.05 | 288.76 | | 35 day EMA | 291.18 | 291.66 | 292.27 | | 50 day EMA | 294.36 | 294.82 | 295.37 |
SMA (simple moving average) of Automatic Data ADP
| SMA period | SMA current | SMA prev | SMA prev2 | | 5 day SMA | 282.92 | 283.18 | 283.97 | | 12 day SMA | 286.29 | 286.86 | 287.73 | | 20 day SMA | 288.22 | 288.75 | 289.28 | | 35 day SMA | 290.99 | 291.59 | 292.24 | | 50 day SMA | 294.91 | 295.32 | 295.82 | | 100 day SMA | 302.04 | 302.47 | 302.87 | | 150 day SMA | 301.91 | 302 | 302.07 | | 200 day SMA | 301.96 | 302 | 302.05 |
|
|
