AgreeRealty ADC full analysis,charts,indicators,moving averages,SMA,DMA,EMA,ADX,MACD,RSIAgree Realty ADC WideScreen charts, DMA,SMA,EMA technical analysis, forecast prediction, by indicators ADX,MACD,RSI,CCI USA stock exchange
operates under Consumer Services sector & deals in Real Estate Investment Trusts
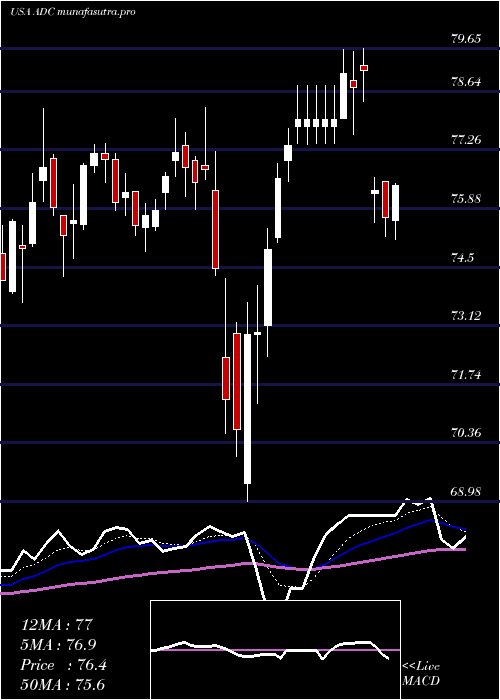
Daily price and charts and targets AgreeRealty Strong Daily Stock price targets for AgreeRealty ADC are 74.22 and 75.48 | Daily Target 1 | 73.95 | | Daily Target 2 | 74.48 | | Daily Target 3 | 75.213333333333 | | Daily Target 4 | 75.74 | | Daily Target 5 | 76.47 |
Daily price and volume Agree Realty
| Date |
Closing |
Open |
Range |
Volume |
Tue 21 October 2025 |
75.00 (-1%) |
75.89 |
74.69 - 75.95 |
1.2151 times |
Mon 20 October 2025 |
75.76 (0.93%) |
75.42 |
75.06 - 75.99 |
0.8724 times |
Fri 17 October 2025 |
75.06 (0.68%) |
74.50 |
74.20 - 75.23 |
0.6911 times |
Thu 16 October 2025 |
74.55 (1.08%) |
73.95 |
73.58 - 74.64 |
0.9021 times |
Wed 15 October 2025 |
73.75 (0.82%) |
73.15 |
72.98 - 74.68 |
1.2437 times |
Tue 14 October 2025 |
73.15 (0.63%) |
72.84 |
72.62 - 73.52 |
1.4102 times |
Mon 13 October 2025 |
72.69 (0.82%) |
71.70 |
71.63 - 72.96 |
0.9895 times |
Fri 10 October 2025 |
72.10 (2.12%) |
70.96 |
70.91 - 72.14 |
1.385 times |
Thu 09 October 2025 |
70.60 (0.11%) |
70.68 |
70.13 - 71.09 |
0.632 times |
Wed 08 October 2025 |
70.52 (0.09%) |
70.40 |
69.90 - 70.68 |
0.6588 times |
Tue 07 October 2025 |
70.46 (0.34%) |
70.22 |
69.76 - 70.71 |
0.6593 times |
Weekly price and charts AgreeRealty Strong weekly Stock price targets for AgreeRealty ADC are 74.2 and 75.5 | Weekly Target 1 | 73.93 | | Weekly Target 2 | 74.46 | | Weekly Target 3 | 75.226666666667 | | Weekly Target 4 | 75.76 | | Weekly Target 5 | 76.53 |
Weekly price and volumes for Agree Realty
| Date |
Closing |
Open |
Range |
Volume |
Tue 21 October 2025 |
75.00 (-0.08%) |
75.42 |
74.69 - 75.99 |
0.6545 times |
Fri 17 October 2025 |
75.06 (4.11%) |
71.70 |
71.63 - 75.23 |
1.6418 times |
Fri 10 October 2025 |
72.10 (2.17%) |
70.95 |
69.76 - 72.14 |
1.2041 times |
Fri 03 October 2025 |
70.57 (-0.97%) |
71.46 |
70.43 - 72.02 |
1.0378 times |
Fri 26 September 2025 |
71.26 (0.06%) |
71.35 |
70.37 - 71.52 |
0.8023 times |
Fri 19 September 2025 |
71.22 (-2.57%) |
73.29 |
71.09 - 73.62 |
1.1291 times |
Fri 12 September 2025 |
73.10 (0.07%) |
72.50 |
71.72 - 74.08 |
1.1528 times |
Fri 05 September 2025 |
73.05 (0.43%) |
72.62 |
71.59 - 73.21 |
0.9064 times |
Fri 29 August 2025 |
72.74 (0%) |
72.69 |
72.27 - 72.96 |
0.2744 times |
Fri 29 August 2025 |
72.74 (-0.53%) |
73.04 |
71.92 - 73.19 |
1.1969 times |
Fri 22 August 2025 |
73.13 (0.79%) |
72.75 |
71.95 - 74.70 |
1.0887 times |
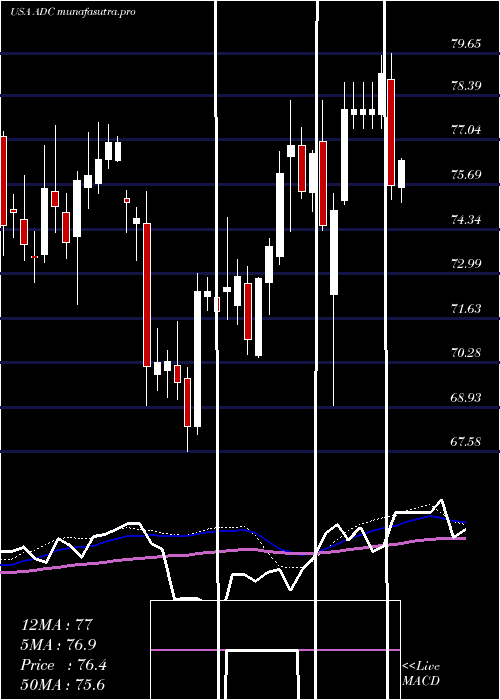
Monthly price and charts AgreeRealty Strong monthly Stock price targets for AgreeRealty ADC are 72.38 and 78.61 | Monthly Target 1 | 67.35 | | Monthly Target 2 | 71.18 | | Monthly Target 3 | 73.583333333333 | | Monthly Target 4 | 77.41 | | Monthly Target 5 | 79.81 |
Monthly price and volumes Agree Realty
| Date |
Closing |
Open |
Range |
Volume |
Tue 21 October 2025 |
75.00 (5.57%) |
71.48 |
69.76 - 75.99 |
0.7575 times |
Tue 30 September 2025 |
71.04 (-2.34%) |
72.62 |
70.37 - 74.08 |
0.8057 times |
Fri 29 August 2025 |
72.74 (1.45%) |
74.33 |
71.91 - 75.13 |
0.9045 times |
Thu 31 July 2025 |
71.70 (-1.86%) |
72.81 |
70.45 - 74.43 |
1.1176 times |
Mon 30 June 2025 |
73.06 (-2.97%) |
74.86 |
71.59 - 76.21 |
0.915 times |
Fri 30 May 2025 |
75.30 (-2.98%) |
77.33 |
72.00 - 77.48 |
1.1455 times |
Wed 30 April 2025 |
77.61 (0.54%) |
77.35 |
68.98 - 79.65 |
1.4437 times |
Mon 31 March 2025 |
77.19 (4.59%) |
73.50 |
73.27 - 78.24 |
1.2474 times |
Fri 28 February 2025 |
73.80 (1.69%) |
72.02 |
70.43 - 74.06 |
0.7827 times |
Fri 31 January 2025 |
72.57 (3.01%) |
70.16 |
67.58 - 74.69 |
0.8804 times |
Tue 31 December 2024 |
70.45 (-8.46%) |
75.27 |
68.97 - 75.50 |
0.6765 times |

DMA SMA EMA moving averages of Agree Realty ADC
DMA (daily moving average) of Agree Realty ADC
| DMA period | DMA value | | 5 day DMA | 74.82 | | 12 day DMA | 72.82 | | 20 day DMA | 72.05 | | 35 day DMA | 72.1 | | 50 day DMA | 72.3 | | 100 day DMA | 72.82 | | 150 day DMA | 73.83 | | 200 day DMA | 73.6 | EMA (exponential moving average) of Agree Realty ADC
| EMA period | EMA current | EMA prev | EMA prev2 | | 5 day EMA | 74.67 | 74.51 | 73.89 | | 12 day EMA | 73.48 | 73.2 | 72.74 | | 20 day EMA | 72.86 | 72.64 | 72.31 | | 35 day EMA | 72.59 | 72.45 | 72.25 | | 50 day EMA | 72.63 | 72.53 | 72.4 |
SMA (simple moving average) of Agree Realty ADC
| SMA period | SMA current | SMA prev | SMA prev2 | | 5 day SMA | 74.82 | 74.45 | 73.84 | | 12 day SMA | 72.82 | 72.45 | 72.03 | | 20 day SMA | 72.05 | 71.87 | 71.62 | | 35 day SMA | 72.1 | 72.02 | 71.94 | | 50 day SMA | 72.3 | 72.25 | 72.19 | | 100 day SMA | 72.82 | 72.83 | 72.83 | | 150 day SMA | 73.83 | 73.84 | 73.85 | | 200 day SMA | 73.6 | 73.58 | 73.55 |
|
|
