AdobeInc ADBE full analysis,charts,indicators,moving averages,SMA,DMA,EMA,ADX,MACD,RSIAdobe Inc ADBE WideScreen charts, DMA,SMA,EMA technical analysis, forecast prediction, by indicators ADX,MACD,RSI,CCI USA stock exchange
operates under Technology sector & deals in Computer Software Prepackaged Software
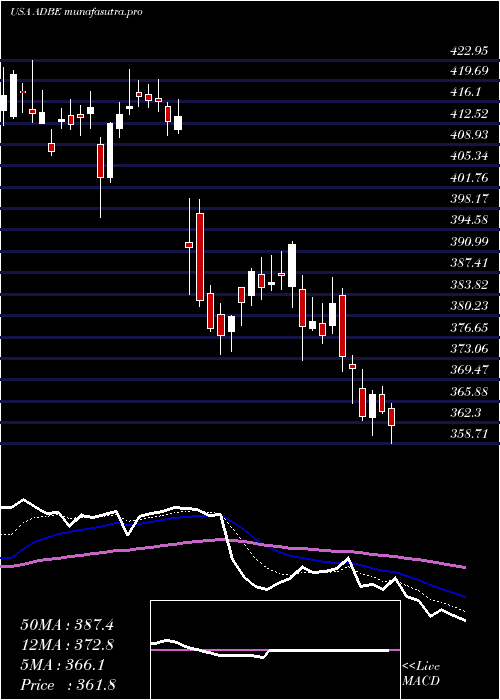
Daily price and charts and targets AdobeInc Strong Daily Stock price targets for AdobeInc ADBE are 338.74 and 348.92 | Daily Target 1 | 330.38 | | Daily Target 2 | 336.91 | | Daily Target 3 | 340.55666666667 | | Daily Target 4 | 347.09 | | Daily Target 5 | 350.74 |
Daily price and volume Adobe Inc
| Date |
Closing |
Open |
Range |
Volume |
Mon 20 October 2025 |
343.45 (3.06%) |
334.31 |
334.02 - 344.20 |
0.48 times |
Fri 17 October 2025 |
333.26 (1.53%) |
327.74 |
327.70 - 335.10 |
1.2553 times |
Thu 16 October 2025 |
328.25 (-0.72%) |
331.35 |
327.50 - 336.65 |
0.8828 times |
Wed 15 October 2025 |
330.63 (-1.58%) |
335.42 |
329.21 - 335.60 |
1.2228 times |
Tue 14 October 2025 |
335.94 (-1%) |
335.22 |
332.72 - 338.82 |
0.9449 times |
Mon 13 October 2025 |
339.32 (0.54%) |
339.25 |
335.61 - 340.28 |
0.9397 times |
Fri 10 October 2025 |
337.51 (-2.87%) |
347.91 |
336.94 - 348.72 |
1.3324 times |
Thu 09 October 2025 |
347.47 (-0.37%) |
349.77 |
344.30 - 350.60 |
0.9009 times |
Wed 08 October 2025 |
348.77 (0.13%) |
350.00 |
347.52 - 354.05 |
1.0221 times |
Tue 07 October 2025 |
348.31 (-0.43%) |
352.59 |
344.24 - 353.33 |
1.0192 times |
Mon 06 October 2025 |
349.80 (0.78%) |
347.09 |
342.04 - 357.34 |
0.9267 times |
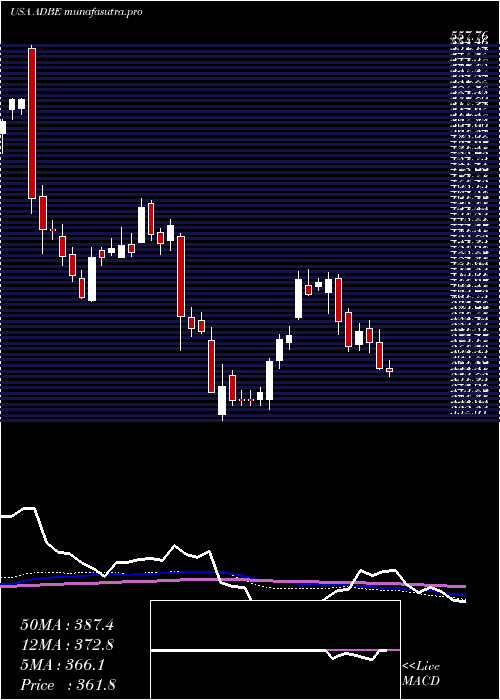
Weekly price and charts AdobeInc Strong weekly Stock price targets for AdobeInc ADBE are 338.74 and 348.92 | Weekly Target 1 | 330.38 | | Weekly Target 2 | 336.91 | | Weekly Target 3 | 340.55666666667 | | Weekly Target 4 | 347.09 | | Weekly Target 5 | 350.74 |
Weekly price and volumes for Adobe Inc
| Date |
Closing |
Open |
Range |
Volume |
Mon 20 October 2025 |
343.45 (3.06%) |
334.31 |
334.02 - 344.20 |
0.0841 times |
Fri 17 October 2025 |
333.26 (-1.26%) |
339.25 |
327.50 - 340.28 |
0.9191 times |
Fri 10 October 2025 |
337.51 (-2.76%) |
347.09 |
336.94 - 357.34 |
0.9114 times |
Fri 03 October 2025 |
347.10 (-3.68%) |
362.04 |
340.05 - 363.17 |
1.1177 times |
Fri 26 September 2025 |
360.37 (-1.51%) |
364.16 |
347.80 - 368.73 |
1.1496 times |
Fri 19 September 2025 |
365.90 (4.73%) |
350.50 |
345.05 - 370.86 |
1.7639 times |
Fri 12 September 2025 |
349.36 (0.11%) |
348.86 |
341.61 - 366.50 |
2.1677 times |
Fri 05 September 2025 |
348.97 (-2.17%) |
350.24 |
331.50 - 354.67 |
0.9183 times |
Fri 29 August 2025 |
356.70 (0%) |
353.99 |
352.45 - 357.25 |
0.1439 times |
Fri 29 August 2025 |
356.70 (-1.49%) |
362.56 |
349.11 - 364.65 |
0.8243 times |
Fri 22 August 2025 |
362.09 (2.04%) |
355.68 |
347.00 - 364.24 |
0.8111 times |
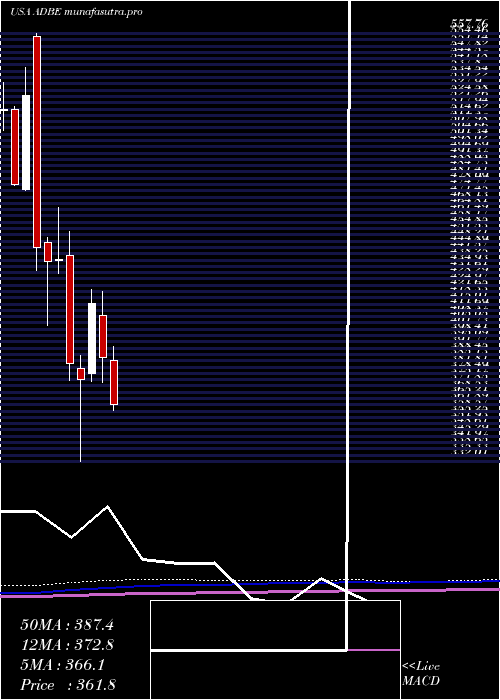
Monthly price and charts AdobeInc Strong monthly Stock price targets for AdobeInc ADBE are 320.56 and 350.4 | Monthly Target 1 | 312.92 | | Monthly Target 2 | 328.19 | | Monthly Target 3 | 342.76333333333 | | Monthly Target 4 | 358.03 | | Monthly Target 5 | 372.6 |
Monthly price and volumes Adobe Inc
| Date |
Closing |
Open |
Range |
Volume |
Mon 20 October 2025 |
343.45 (-2.64%) |
347.16 |
327.50 - 357.34 |
0.6049 times |
Tue 30 September 2025 |
352.75 (-1.11%) |
350.24 |
331.50 - 370.86 |
1.5649 times |
Fri 29 August 2025 |
356.70 (-0.28%) |
355.95 |
330.04 - 364.65 |
0.9449 times |
Thu 31 July 2025 |
357.69 (-7.54%) |
385.10 |
354.27 - 392.58 |
0.9832 times |
Mon 30 June 2025 |
386.88 (-6.8%) |
408.88 |
373.76 - 421.48 |
1.1024 times |
Fri 30 May 2025 |
415.09 (10.7%) |
378.30 |
374.07 - 422.95 |
0.7476 times |
Wed 30 April 2025 |
374.98 (-2.23%) |
381.13 |
332.01 - 388.00 |
1.0897 times |
Mon 31 March 2025 |
383.53 (-12.55%) |
440.65 |
374.50 - 453.26 |
1.0908 times |
Fri 28 February 2025 |
438.56 (0.25%) |
437.80 |
430.88 - 465.70 |
0.7259 times |
Fri 31 January 2025 |
437.45 (-1.63%) |
447.76 |
403.75 - 450.12 |
1.1457 times |
Tue 31 December 2024 |
444.68 (-15.35%) |
556.10 |
432.47 - 557.76 |
1.1059 times |
DMA SMA EMA moving averages of Adobe Inc ADBE
DMA (daily moving average) of Adobe Inc ADBE
| DMA period | DMA value | | 5 day DMA | 334.31 | | 12 day DMA | 340.82 | | 20 day DMA | 346.33 | | 35 day DMA | 349.61 | | 50 day DMA | 351.16 | | 100 day DMA | 365.61 | | 150 day DMA | 369.64 | | 200 day DMA | 386.57 | EMA (exponential moving average) of Adobe Inc ADBE
| EMA period | EMA current | EMA prev | EMA prev2 | | 5 day EMA | 337.13 | 333.97 | 334.32 | | 12 day EMA | 340.39 | 339.83 | 341.02 | | 20 day EMA | 343.72 | 343.75 | 344.85 | | 35 day EMA | 346.42 | 346.59 | 347.38 | | 50 day EMA | 348.56 | 348.77 | 349.4 |
SMA (simple moving average) of Adobe Inc ADBE
| SMA period | SMA current | SMA prev | SMA prev2 | | 5 day SMA | 334.31 | 333.48 | 334.33 | | 12 day SMA | 340.82 | 341.48 | 342.35 | | 20 day SMA | 346.33 | 347.37 | 349 | | 35 day SMA | 349.61 | 349.98 | 350.65 | | 50 day SMA | 351.16 | 350.97 | 351.12 | | 100 day SMA | 365.61 | 366.31 | 367.05 | | 150 day SMA | 369.64 | 369.87 | 370.57 | | 200 day SMA | 386.57 | 387.08 | 387.64 |
|
|
