AdvisorsharesVice ACT full analysis,charts,indicators,moving averages,SMA,DMA,EMA,ADX,MACD,RSIAdvisorshares Vice ACT WideScreen charts, DMA,SMA,EMA technical analysis, forecast prediction, by indicators ADX,MACD,RSI,CCI USA stock exchange
operates under N A sector & deals in N A
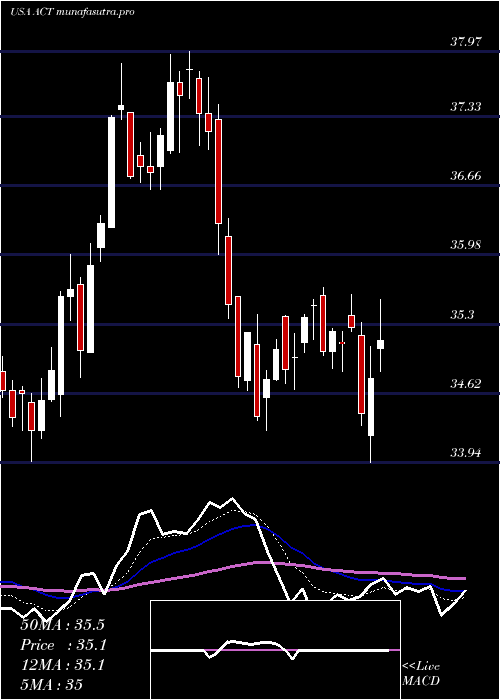
Daily price and charts and targets AdvisorsharesVice Strong Daily Stock price targets for AdvisorsharesVice ACT are 35.52 and 36.03 | Daily Target 1 | 35.1 | | Daily Target 2 | 35.43 | | Daily Target 3 | 35.613333333333 | | Daily Target 4 | 35.94 | | Daily Target 5 | 36.12 |
Daily price and volume Advisorshares Vice
| Date |
Closing |
Open |
Range |
Volume |
Mon 20 October 2025 |
35.75 (0.62%) |
35.62 |
35.29 - 35.80 |
0.5918 times |
Fri 17 October 2025 |
35.53 (1.43%) |
35.28 |
35.12 - 35.60 |
0.9721 times |
Thu 16 October 2025 |
35.03 (-2.01%) |
35.60 |
34.87 - 35.62 |
1.167 times |
Wed 15 October 2025 |
35.75 (-1.62%) |
36.33 |
35.63 - 36.43 |
1.1083 times |
Tue 14 October 2025 |
36.34 (1.74%) |
35.61 |
35.41 - 36.39 |
0.7479 times |
Mon 13 October 2025 |
35.72 (0.93%) |
35.42 |
35.23 - 35.82 |
0.7381 times |
Fri 10 October 2025 |
35.39 (-0.51%) |
35.69 |
35.33 - 35.88 |
1.0656 times |
Thu 09 October 2025 |
35.57 (-1.33%) |
35.91 |
35.44 - 36.07 |
1.2747 times |
Wed 08 October 2025 |
36.05 (0.39%) |
36.04 |
35.76 - 36.74 |
1.0553 times |
Tue 07 October 2025 |
35.91 (-0.33%) |
36.02 |
35.80 - 36.21 |
1.2791 times |
Mon 06 October 2025 |
36.03 (-2.04%) |
36.78 |
35.82 - 37.01 |
1.2251 times |
Weekly price and charts AdvisorsharesVice Strong weekly Stock price targets for AdvisorsharesVice ACT are 35.52 and 36.03 | Weekly Target 1 | 35.1 | | Weekly Target 2 | 35.43 | | Weekly Target 3 | 35.613333333333 | | Weekly Target 4 | 35.94 | | Weekly Target 5 | 36.12 |
Weekly price and volumes for Advisorshares Vice
| Date |
Closing |
Open |
Range |
Volume |
Mon 20 October 2025 |
35.75 (0.62%) |
35.62 |
35.29 - 35.80 |
0.1144 times |
Fri 17 October 2025 |
35.53 (0.4%) |
35.42 |
34.87 - 36.43 |
0.9148 times |
Fri 10 October 2025 |
35.39 (-3.78%) |
36.78 |
35.33 - 37.01 |
1.1402 times |
Fri 03 October 2025 |
36.78 (-5.93%) |
39.07 |
36.43 - 39.25 |
1.0513 times |
Fri 26 September 2025 |
39.10 (1.72%) |
38.29 |
38.11 - 39.26 |
1.5559 times |
Fri 19 September 2025 |
38.44 (-1.21%) |
38.93 |
37.55 - 39.28 |
2.0366 times |
Fri 12 September 2025 |
38.91 (0.88%) |
38.51 |
38.12 - 39.47 |
1.3257 times |
Fri 05 September 2025 |
38.57 (2.44%) |
37.51 |
36.93 - 38.64 |
0.8104 times |
Fri 29 August 2025 |
37.65 (0%) |
37.44 |
37.44 - 37.87 |
0.2169 times |
Fri 29 August 2025 |
37.65 (-2.81%) |
38.67 |
37.40 - 38.70 |
0.8338 times |
Fri 22 August 2025 |
38.74 (3.47%) |
37.23 |
37.12 - 38.87 |
0.6787 times |

Monthly price and charts AdvisorsharesVice Strong monthly Stock price targets for AdvisorsharesVice ACT are 33.56 and 37.07 | Monthly Target 1 | 32.82 | | Monthly Target 2 | 34.29 | | Monthly Target 3 | 36.333333333333 | | Monthly Target 4 | 37.8 | | Monthly Target 5 | 39.84 |
Monthly price and volumes Advisorshares Vice
| Date |
Closing |
Open |
Range |
Volume |
Mon 20 October 2025 |
35.75 (-6.76%) |
38.17 |
34.87 - 38.38 |
0.5674 times |
Tue 30 September 2025 |
38.34 (1.83%) |
37.51 |
36.93 - 39.47 |
1.292 times |
Fri 29 August 2025 |
37.65 (8.31%) |
35.06 |
34.83 - 38.87 |
0.7155 times |
Thu 31 July 2025 |
34.76 (-6.43%) |
37.00 |
33.94 - 37.97 |
0.9352 times |
Mon 30 June 2025 |
37.15 (4.94%) |
35.23 |
33.95 - 37.86 |
1.2448 times |
Fri 30 May 2025 |
35.40 (-1.09%) |
36.74 |
34.95 - 37.56 |
1.2232 times |
Wed 30 April 2025 |
35.79 (2.99%) |
34.71 |
31.28 - 36.47 |
1.9783 times |
Mon 31 March 2025 |
34.75 (1.08%) |
34.26 |
32.51 - 34.98 |
0.4899 times |
Fri 28 February 2025 |
34.38 (1.78%) |
33.22 |
32.75 - 34.40 |
0.6527 times |
Fri 31 January 2025 |
33.78 (4.32%) |
32.52 |
30.79 - 34.41 |
0.901 times |
Tue 31 December 2024 |
32.38 (-8.14%) |
34.80 |
32.05 - 34.93 |
0.4288 times |

DMA SMA EMA moving averages of Advisorshares Vice ACT
DMA (daily moving average) of Advisorshares Vice ACT
| DMA period | DMA value | | 5 day DMA | 35.68 | | 12 day DMA | 35.82 | | 20 day DMA | 36.84 | | 35 day DMA | 37.49 | | 50 day DMA | 37.6 | | 100 day DMA | 36.66 | | 150 day DMA | 36.15 | | 200 day DMA | 35.42 | EMA (exponential moving average) of Advisorshares Vice ACT
| EMA period | EMA current | EMA prev | EMA prev2 | | 5 day EMA | 35.64 | 35.59 | 35.62 | | 12 day EMA | 36.05 | 36.1 | 36.2 | | 20 day EMA | 36.48 | 36.56 | 36.67 | | 35 day EMA | 36.91 | 36.98 | 37.07 | | 50 day EMA | 37.32 | 37.38 | 37.46 |
SMA (simple moving average) of Advisorshares Vice ACT
| SMA period | SMA current | SMA prev | SMA prev2 | | 5 day SMA | 35.68 | 35.67 | 35.65 | | 12 day SMA | 35.82 | 35.92 | 36.12 | | 20 day SMA | 36.84 | 36.97 | 37.12 | | 35 day SMA | 37.49 | 37.54 | 37.6 | | 50 day SMA | 37.6 | 37.63 | 37.66 | | 100 day SMA | 36.66 | 36.66 | 36.66 | | 150 day SMA | 36.15 | 36.13 | 36.11 | | 200 day SMA | 35.42 | 35.4 | 35.39 |
|
|
