AcnbCorporation ACNB full analysis,charts,indicators,moving averages,SMA,DMA,EMA,ADX,MACD,RSIAcnb Corporation ACNB WideScreen charts, DMA,SMA,EMA technical analysis, forecast prediction, by indicators ADX,MACD,RSI,CCI USA stock exchange
operates under Finance sector & deals in Major Banks
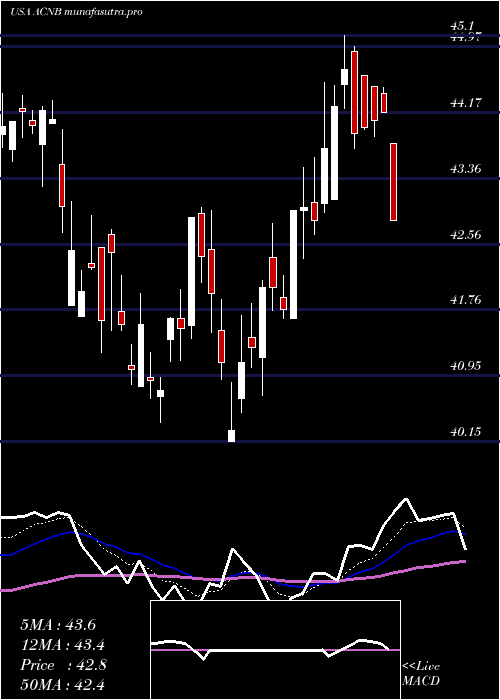
Daily price and charts and targets AcnbCorporation Strong Daily Stock price targets for AcnbCorporation ACNB are 43.67 and 44.91 | Daily Target 1 | 42.64 | | Daily Target 2 | 43.46 | | Daily Target 3 | 43.876666666667 | | Daily Target 4 | 44.7 | | Daily Target 5 | 45.12 |
Daily price and volume Acnb Corporation
| Date |
Closing |
Open |
Range |
Volume |
Mon 20 October 2025 |
44.29 (2.45%) |
43.05 |
43.05 - 44.29 |
0.9576 times |
Fri 17 October 2025 |
43.23 (0.63%) |
43.20 |
43.00 - 43.90 |
1.1747 times |
Thu 16 October 2025 |
42.96 (-2.81%) |
43.52 |
42.81 - 43.74 |
1.5745 times |
Wed 15 October 2025 |
44.20 (-0.9%) |
44.64 |
44.10 - 44.64 |
0.7749 times |
Tue 14 October 2025 |
44.60 (2.04%) |
43.20 |
43.20 - 44.70 |
1.0415 times |
Mon 13 October 2025 |
43.71 (2.8%) |
43.25 |
42.99 - 43.91 |
1.1056 times |
Fri 10 October 2025 |
42.52 (-2.61%) |
43.57 |
42.52 - 43.85 |
1.1352 times |
Thu 09 October 2025 |
43.66 (-0.32%) |
43.61 |
43.25 - 43.78 |
0.459 times |
Wed 08 October 2025 |
43.80 (0.64%) |
43.50 |
43.35 - 43.94 |
0.7206 times |
Tue 07 October 2025 |
43.52 (-1.05%) |
43.66 |
43.49 - 43.91 |
1.0563 times |
Mon 06 October 2025 |
43.98 (0.53%) |
43.96 |
43.66 - 43.98 |
0.7058 times |
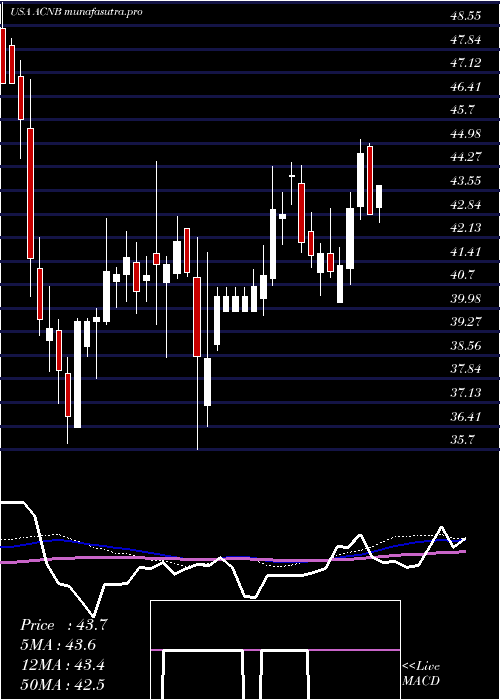
Weekly price and charts AcnbCorporation Strong weekly Stock price targets for AcnbCorporation ACNB are 43.67 and 44.91 | Weekly Target 1 | 42.64 | | Weekly Target 2 | 43.46 | | Weekly Target 3 | 43.876666666667 | | Weekly Target 4 | 44.7 | | Weekly Target 5 | 45.12 |
Weekly price and volumes for Acnb Corporation
| Date |
Closing |
Open |
Range |
Volume |
Mon 20 October 2025 |
44.29 (2.45%) |
43.05 |
43.05 - 44.29 |
0.2631 times |
Fri 17 October 2025 |
43.23 (1.67%) |
43.25 |
42.81 - 44.70 |
1.5584 times |
Fri 10 October 2025 |
42.52 (-2.81%) |
43.96 |
42.52 - 43.98 |
1.1203 times |
Fri 03 October 2025 |
43.75 (-2.06%) |
44.73 |
42.98 - 44.73 |
0.9844 times |
Fri 26 September 2025 |
44.67 (-1.09%) |
44.65 |
44.00 - 44.86 |
0.9454 times |
Fri 19 September 2025 |
45.16 (0.47%) |
45.00 |
44.12 - 46.30 |
1.8812 times |
Fri 12 September 2025 |
44.95 (0.09%) |
44.91 |
44.20 - 45.47 |
0.7826 times |
Fri 05 September 2025 |
44.91 (-0.9%) |
44.34 |
43.81 - 45.75 |
1.3631 times |
Fri 29 August 2025 |
45.32 (0%) |
45.94 |
45.08 - 45.94 |
0.2048 times |
Fri 29 August 2025 |
45.32 (-2.73%) |
46.22 |
45.08 - 46.70 |
0.8965 times |
Fri 22 August 2025 |
46.59 (5.62%) |
43.98 |
42.63 - 46.85 |
1.9165 times |
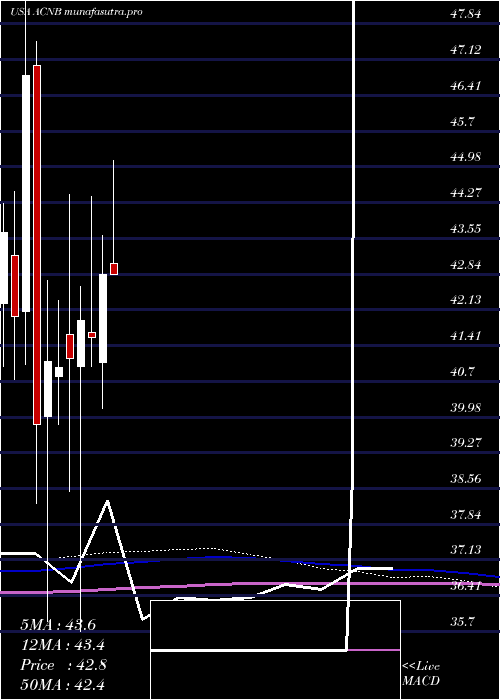
Monthly price and charts AcnbCorporation Strong monthly Stock price targets for AcnbCorporation ACNB are 43.41 and 45.59 | Monthly Target 1 | 41.66 | | Monthly Target 2 | 42.97 | | Monthly Target 3 | 43.836666666667 | | Monthly Target 4 | 45.15 | | Monthly Target 5 | 46.02 |
Monthly price and volumes Acnb Corporation
| Date |
Closing |
Open |
Range |
Volume |
Mon 20 October 2025 |
44.29 (0.57%) |
43.81 |
42.52 - 44.70 |
0.4632 times |
Tue 30 September 2025 |
44.04 (-2.82%) |
44.34 |
43.50 - 46.30 |
0.7076 times |
Fri 29 August 2025 |
45.32 (7.65%) |
41.83 |
40.80 - 46.85 |
0.7365 times |
Thu 31 July 2025 |
42.10 (-1.73%) |
43.05 |
41.81 - 45.10 |
0.8002 times |
Mon 30 June 2025 |
42.84 (3.06%) |
41.08 |
40.15 - 43.61 |
1.3202 times |
Fri 30 May 2025 |
41.57 (-0.81%) |
41.68 |
40.99 - 44.39 |
0.734 times |
Wed 30 April 2025 |
41.91 (1.82%) |
41.00 |
35.70 - 42.59 |
1.3101 times |
Mon 31 March 2025 |
41.16 (0.46%) |
41.64 |
38.50 - 44.42 |
1.5809 times |
Fri 28 February 2025 |
40.97 (-0.32%) |
40.79 |
39.83 - 42.32 |
1.0741 times |
Fri 31 January 2025 |
41.10 (3.19%) |
40.00 |
35.89 - 42.72 |
1.2732 times |
Tue 31 December 2024 |
39.83 (-14.91%) |
47.01 |
38.25 - 47.49 |
0.4905 times |
DMA SMA EMA moving averages of Acnb Corporation ACNB
DMA (daily moving average) of Acnb Corporation ACNB
| DMA period | DMA value | | 5 day DMA | 43.86 | | 12 day DMA | 43.69 | | 20 day DMA | 43.9 | | 35 day DMA | 44.36 | | 50 day DMA | 44.62 | | 100 day DMA | 43.55 | | 150 day DMA | 42.86 | | 200 day DMA | 42.21 | EMA (exponential moving average) of Acnb Corporation ACNB
| EMA period | EMA current | EMA prev | EMA prev2 | | 5 day EMA | 43.76 | 43.5 | 43.63 | | 12 day EMA | 43.8 | 43.71 | 43.8 | | 20 day EMA | 43.93 | 43.89 | 43.96 | | 35 day EMA | 44.08 | 44.07 | 44.12 | | 50 day EMA | 44.34 | 44.34 | 44.39 |
SMA (simple moving average) of Acnb Corporation ACNB
| SMA period | SMA current | SMA prev | SMA prev2 | | 5 day SMA | 43.86 | 43.74 | 43.6 | | 12 day SMA | 43.69 | 43.69 | 43.72 | | 20 day SMA | 43.9 | 43.91 | 44.01 | | 35 day SMA | 44.36 | 44.39 | 44.45 | | 50 day SMA | 44.62 | 44.59 | 44.58 | | 100 day SMA | 43.55 | 43.53 | 43.52 | | 150 day SMA | 42.86 | 42.84 | 42.82 | | 200 day SMA | 42.21 | 42.18 | 42.16 |
|
|
