Aecom ACM full analysis,charts,indicators,moving averages,SMA,DMA,EMA,ADX,MACD,RSIAecom ACM WideScreen charts, DMA,SMA,EMA technical analysis, forecast prediction, by indicators ADX,MACD,RSI,CCI USA stock exchange
operates under Consumer Services sector & deals in Military Government Technical
Daily price and charts and targets Aecom Strong Daily Stock price targets for Aecom ACM are 132.62 and 135.55 | Daily Target 1 | 130.32 | | Daily Target 2 | 131.98 | | Daily Target 3 | 133.24666666667 | | Daily Target 4 | 134.91 | | Daily Target 5 | 136.18 |
Daily price and volume Aecom
| Date |
Closing |
Open |
Range |
Volume |
Mon 20 October 2025 |
133.65 (2.12%) |
132.04 |
131.58 - 134.51 |
1.0817 times |
Fri 17 October 2025 |
130.87 (-0.1%) |
131.00 |
129.82 - 132.03 |
1.1593 times |
Thu 16 October 2025 |
131.00 (-1.36%) |
133.28 |
130.57 - 133.40 |
0.9339 times |
Wed 15 October 2025 |
132.81 (0.2%) |
133.45 |
132.00 - 133.85 |
0.8021 times |
Tue 14 October 2025 |
132.55 (0.76%) |
129.92 |
129.75 - 133.00 |
0.9861 times |
Mon 13 October 2025 |
131.55 (2.14%) |
130.32 |
130.00 - 132.77 |
1.0322 times |
Fri 10 October 2025 |
128.80 (-1.9%) |
131.29 |
128.68 - 131.79 |
0.9372 times |
Thu 09 October 2025 |
131.29 (-1.02%) |
133.18 |
129.26 - 133.39 |
0.7925 times |
Wed 08 October 2025 |
132.64 (2.48%) |
130.69 |
129.55 - 133.20 |
0.8825 times |
Tue 07 October 2025 |
129.43 (-0.07%) |
130.34 |
128.00 - 130.34 |
1.3925 times |
Mon 06 October 2025 |
129.52 (0.47%) |
129.45 |
127.61 - 130.50 |
0.544 times |
Weekly price and charts Aecom Strong weekly Stock price targets for Aecom ACM are 132.62 and 135.55 | Weekly Target 1 | 130.32 | | Weekly Target 2 | 131.98 | | Weekly Target 3 | 133.24666666667 | | Weekly Target 4 | 134.91 | | Weekly Target 5 | 136.18 |
Weekly price and volumes for Aecom
| Date |
Closing |
Open |
Range |
Volume |
Mon 20 October 2025 |
133.65 (2.12%) |
132.04 |
131.58 - 134.51 |
0.2153 times |
Fri 17 October 2025 |
130.87 (1.61%) |
130.32 |
129.75 - 133.85 |
0.9779 times |
Fri 10 October 2025 |
128.80 (-0.09%) |
129.45 |
127.61 - 133.39 |
0.9053 times |
Fri 03 October 2025 |
128.91 (-0.26%) |
130.08 |
127.55 - 131.46 |
0.924 times |
Fri 26 September 2025 |
129.25 (-2.44%) |
132.00 |
127.58 - 133.50 |
1.2655 times |
Fri 19 September 2025 |
132.48 (4.64%) |
127.10 |
126.43 - 133.81 |
2.0559 times |
Fri 12 September 2025 |
126.60 (-0.02%) |
126.60 |
123.89 - 127.94 |
1.0515 times |
Fri 05 September 2025 |
126.62 (1.39%) |
124.00 |
123.00 - 128.04 |
0.9593 times |
Fri 29 August 2025 |
124.89 (0%) |
125.97 |
123.87 - 125.97 |
0.237 times |
Fri 29 August 2025 |
124.89 (1.55%) |
122.87 |
122.49 - 126.29 |
1.4083 times |
Fri 22 August 2025 |
122.98 (2.85%) |
119.58 |
119.13 - 124.65 |
0.7495 times |
Monthly price and charts Aecom Strong monthly Stock price targets for Aecom ACM are 130.6 and 137.56 | Monthly Target 1 | 124.94 | | Monthly Target 2 | 129.3 | | Monthly Target 3 | 131.90333333333 | | Monthly Target 4 | 136.26 | | Monthly Target 5 | 138.86 |
Monthly price and volumes Aecom
| Date |
Closing |
Open |
Range |
Volume |
Mon 20 October 2025 |
133.65 (2.44%) |
129.75 |
127.55 - 134.51 |
0.5368 times |
Tue 30 September 2025 |
130.47 (4.47%) |
124.00 |
123.00 - 133.81 |
1.1608 times |
Fri 29 August 2025 |
124.89 (10.78%) |
111.04 |
108.79 - 126.29 |
0.9303 times |
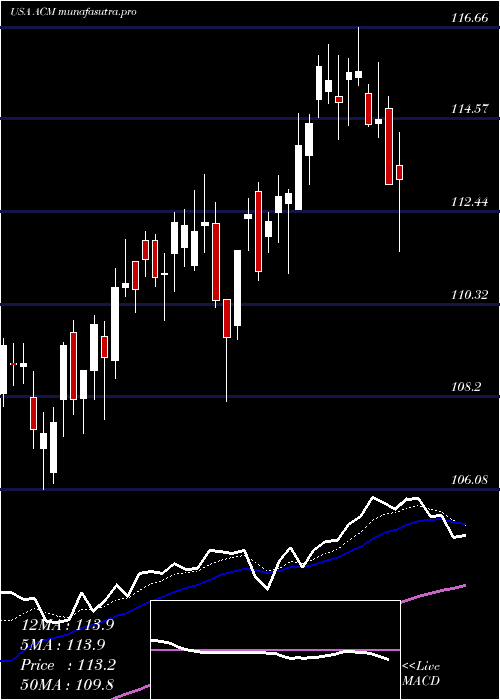
Thu 31 July 2025 |
112.74 (-0.11%) |
112.49 |
111.53 - 116.66 |
0.9299 times |
Mon 30 June 2025 |
112.86 (2.74%) |
109.59 |
107.68 - 113.29 |
0.9949 times |
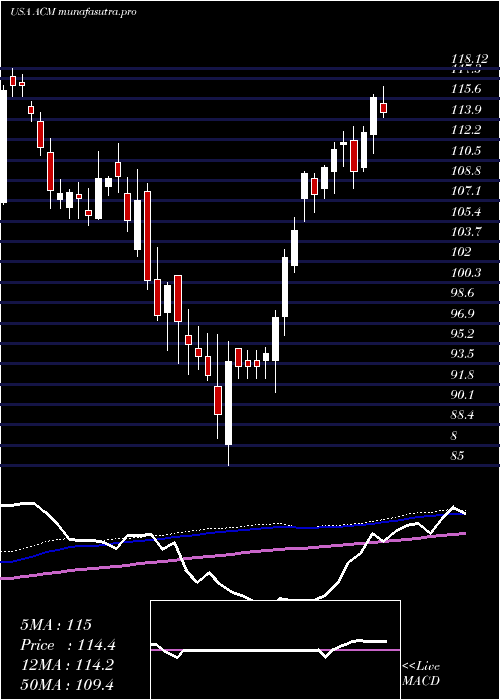
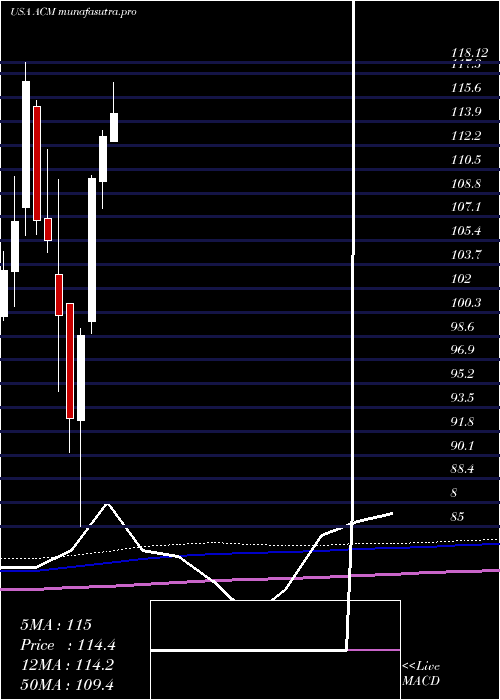
Fri 30 May 2025 |
109.85 (11.35%) |
99.61 |
98.76 - 110.07 |
0.9508 times |
Wed 30 April 2025 |
98.65 (6.38%) |
92.59 |
85.00 - 99.12 |
1.1678 times |
Mon 31 March 2025 |
92.73 (-7.32%) |
100.90 |
90.31 - 100.90 |
1.007 times |
Fri 28 February 2025 |
100.05 (-5.11%) |
103.01 |
94.62 - 109.73 |
1.0845 times |
Fri 31 January 2025 |
105.44 (-1.29%) |
107.00 |
104.54 - 111.88 |
1.2372 times |
Tue 31 December 2024 |
106.82 (-8.5%) |
115.00 |
105.84 - 115.40 |
0.5389 times |
DMA SMA EMA moving averages of Aecom ACM
DMA (daily moving average) of Aecom ACM
| DMA period | DMA value | | 5 day DMA | 132.18 | | 12 day DMA | 131.09 | | 20 day DMA | 130.52 | | 35 day DMA | 129.25 | | 50 day DMA | 127.24 | | 100 day DMA | 120.17 | | 150 day DMA | 112.89 | | 200 day DMA | 110.45 | EMA (exponential moving average) of Aecom ACM
| EMA period | EMA current | EMA prev | EMA prev2 | | 5 day EMA | 132.08 | 131.3 | 131.51 | | 12 day EMA | 131.32 | 130.9 | 130.91 | | 20 day EMA | 130.56 | 130.23 | 130.16 | | 35 day EMA | 128.73 | 128.44 | 128.3 | | 50 day EMA | 127.05 | 126.78 | 126.61 |
SMA (simple moving average) of Aecom ACM
| SMA period | SMA current | SMA prev | SMA prev2 | | 5 day SMA | 132.18 | 131.76 | 131.34 | | 12 day SMA | 131.09 | 130.75 | 130.71 | | 20 day SMA | 130.52 | 130.49 | 130.57 | | 35 day SMA | 129.25 | 129 | 128.83 | | 50 day SMA | 127.24 | 126.95 | 126.7 | | 100 day SMA | 120.17 | 119.93 | 119.7 | | 150 day SMA | 112.89 | 112.64 | 112.39 | | 200 day SMA | 110.45 | 110.31 | 110.19 |
|
|
