AcImmune ACIU full analysis,charts,indicators,moving averages,SMA,DMA,EMA,ADX,MACD,RSIAc Immune ACIU WideScreen charts, DMA,SMA,EMA technical analysis, forecast prediction, by indicators ADX,MACD,RSI,CCI USA stock exchange
operates under Health Care sector & deals in Major Pharmaceuticals
Daily price and charts and targets AcImmune Strong Daily Stock price targets for AcImmune ACIU are 2.9 and 3.1 | Daily Target 1 | 2.75 | | Daily Target 2 | 2.85 | | Daily Target 3 | 2.95 | | Daily Target 4 | 3.05 | | Daily Target 5 | 3.15 |
Daily price and volume Ac Immune
| Date |
Closing |
Open |
Range |
Volume |
Mon 20 October 2025 |
2.95 (1.72%) |
2.91 |
2.85 - 3.05 |
0.5808 times |
Fri 17 October 2025 |
2.90 (-2.03%) |
2.94 |
2.87 - 3.11 |
0.7295 times |
Thu 16 October 2025 |
2.96 (-3.58%) |
3.07 |
2.95 - 3.21 |
0.7212 times |
Wed 15 October 2025 |
3.07 (0%) |
3.00 |
2.89 - 3.12 |
1.0182 times |
Tue 14 October 2025 |
3.07 (-11.53%) |
3.51 |
3.05 - 3.51 |
1.3109 times |
Mon 13 October 2025 |
3.47 (-2.25%) |
3.55 |
3.45 - 3.69 |
0.8506 times |
Fri 10 October 2025 |
3.55 (2.01%) |
3.54 |
3.46 - 3.76 |
1.3424 times |
Thu 09 October 2025 |
3.48 (-1.14%) |
3.60 |
3.43 - 3.79 |
1.2737 times |
Wed 08 October 2025 |
3.52 (-1.95%) |
3.61 |
3.41 - 3.78 |
0.5247 times |
Tue 07 October 2025 |
3.59 (0%) |
3.61 |
3.43 - 3.80 |
1.6481 times |
Mon 06 October 2025 |
3.59 (-10.03%) |
3.91 |
3.41 - 3.98 |
1.7375 times |
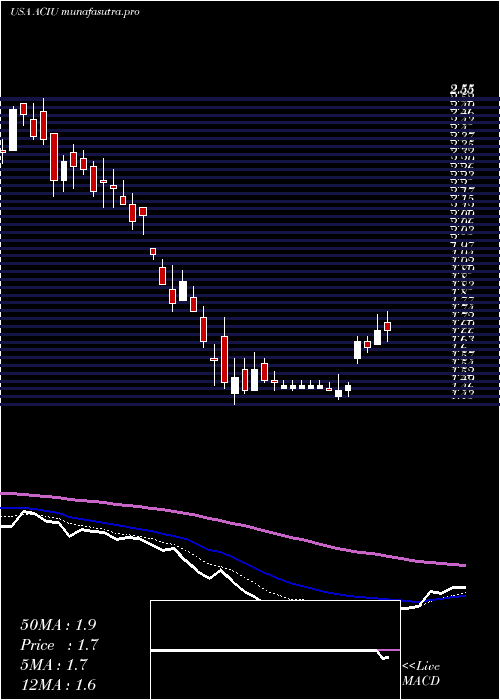
Weekly price and charts AcImmune Strong weekly Stock price targets for AcImmune ACIU are 2.9 and 3.1 | Weekly Target 1 | 2.75 | | Weekly Target 2 | 2.85 | | Weekly Target 3 | 2.95 | | Weekly Target 4 | 3.05 | | Weekly Target 5 | 3.15 |
Weekly price and volumes for Ac Immune
| Date |
Closing |
Open |
Range |
Volume |
Mon 20 October 2025 |
2.95 (1.72%) |
2.91 |
2.85 - 3.05 |
0.2082 times |
Fri 17 October 2025 |
2.90 (-18.31%) |
3.55 |
2.87 - 3.69 |
1.66 times |
Fri 10 October 2025 |
3.55 (-11.03%) |
3.91 |
3.41 - 3.98 |
2.3397 times |
Fri 03 October 2025 |
3.99 (40.49%) |
2.85 |
2.81 - 3.99 |
1.9177 times |
Fri 26 September 2025 |
2.84 (15.92%) |
2.41 |
2.39 - 3.02 |
0.9942 times |
Fri 19 September 2025 |
2.45 (0.82%) |
2.42 |
2.35 - 2.59 |
0.6015 times |
Fri 12 September 2025 |
2.43 (6.58%) |
2.31 |
2.16 - 2.44 |
0.7295 times |
Fri 05 September 2025 |
2.28 (11.76%) |
2.07 |
2.04 - 2.35 |
0.9738 times |
Fri 29 August 2025 |
2.04 (0%) |
2.05 |
2.03 - 2.07 |
0.1118 times |
Fri 29 August 2025 |
2.04 (-5.12%) |
2.13 |
2.03 - 2.19 |
0.4634 times |
Fri 22 August 2025 |
2.15 (0.94%) |
2.10 |
2.04 - 2.19 |
0.4308 times |
Monthly price and charts AcImmune Strong monthly Stock price targets for AcImmune ACIU are 2.9 and 4.04 | Monthly Target 1 | 2.12 | | Monthly Target 2 | 2.54 | | Monthly Target 3 | 3.2633333333333 | | Monthly Target 4 | 3.68 | | Monthly Target 5 | 4.4 |
Monthly price and volumes Ac Immune
| Date |
Closing |
Open |
Range |
Volume |
Mon 20 October 2025 |
2.95 (2.08%) |
2.90 |
2.85 - 3.99 |
1.6619 times |
Tue 30 September 2025 |
2.89 (41.67%) |
2.07 |
2.04 - 3.10 |
1.0975 times |
Fri 29 August 2025 |
2.04 (-5.56%) |
2.10 |
2.03 - 2.50 |
0.6693 times |
Thu 31 July 2025 |
2.16 (6.4%) |
2.03 |
1.65 - 2.52 |
1.0236 times |
Mon 30 June 2025 |
2.03 (18.71%) |
1.70 |
1.60 - 2.23 |
0.7504 times |
Fri 30 May 2025 |
1.71 (-1.16%) |
1.72 |
1.51 - 1.80 |
0.6735 times |
Wed 30 April 2025 |
1.73 (-7.49%) |
1.85 |
1.43 - 1.94 |
1.0599 times |
Mon 31 March 2025 |
1.87 (-26.38%) |
2.53 |
1.87 - 2.56 |
1.0106 times |
Fri 28 February 2025 |
2.54 (-7.64%) |
2.72 |
2.39 - 2.85 |
1.1619 times |
Fri 31 January 2025 |
2.75 (1.85%) |
2.70 |
2.56 - 3.09 |
0.8915 times |
Tue 31 December 2024 |
2.70 (-20.59%) |
3.18 |
2.60 - 3.21 |
0.683 times |

DMA SMA EMA moving averages of Ac Immune ACIU
DMA (daily moving average) of Ac Immune ACIU
| DMA period | DMA value | | 5 day DMA | 2.99 | | 12 day DMA | 3.35 | | 20 day DMA | 3.17 | | 35 day DMA | 2.82 | | 50 day DMA | 2.61 | | 100 day DMA | 2.33 | | 150 day DMA | 2.12 | | 200 day DMA | 2.24 | EMA (exponential moving average) of Ac Immune ACIU
| EMA period | EMA current | EMA prev | EMA prev2 | | 5 day EMA | 3.03 | 3.07 | 3.16 | | 12 day EMA | 3.13 | 3.16 | 3.21 | | 20 day EMA | 3.07 | 3.08 | 3.1 | | 35 day EMA | 2.88 | 2.88 | 2.88 | | 50 day EMA | 2.61 | 2.6 | 2.59 |
SMA (simple moving average) of Ac Immune ACIU
| SMA period | SMA current | SMA prev | SMA prev2 | | 5 day SMA | 2.99 | 3.09 | 3.22 | | 12 day SMA | 3.35 | 3.37 | 3.38 | | 20 day SMA | 3.17 | 3.14 | 3.12 | | 35 day SMA | 2.82 | 2.8 | 2.77 | | 50 day SMA | 2.61 | 2.59 | 2.57 | | 100 day SMA | 2.33 | 2.32 | 2.3 | | 150 day SMA | 2.12 | 2.12 | 2.11 | | 200 day SMA | 2.24 | 2.24 | 2.24 |
|
|
