ArchCapital ACGL full analysis,charts,indicators,moving averages,SMA,DMA,EMA,ADX,MACD,RSIArch Capital ACGL WideScreen charts, DMA,SMA,EMA technical analysis, forecast prediction, by indicators ADX,MACD,RSI,CCI USA stock exchange
operates under Finance sector & deals in Property Casualty Insurers
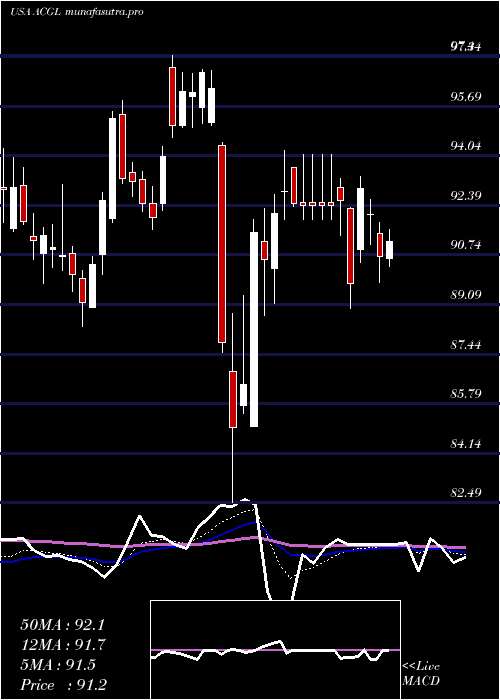
Daily price and charts and targets ArchCapital Strong Daily Stock price targets for ArchCapital ACGL are 87.03 and 88.74 | Daily Target 1 | 85.66 | | Daily Target 2 | 86.68 | | Daily Target 3 | 87.37 | | Daily Target 4 | 88.39 | | Daily Target 5 | 89.08 |
Daily price and volume Arch Capital
| Date |
Closing |
Open |
Range |
Volume |
Tue 21 October 2025 |
87.70 (0.84%) |
86.84 |
86.35 - 88.06 |
0.685 times |
Mon 20 October 2025 |
86.97 (0.53%) |
87.11 |
86.00 - 87.25 |
0.784 times |
Fri 17 October 2025 |
86.51 (0.32%) |
86.51 |
86.31 - 87.43 |
2.678 times |
Thu 16 October 2025 |
86.23 (-3.73%) |
88.34 |
85.93 - 88.50 |
1.4532 times |
Wed 15 October 2025 |
89.57 (-2.88%) |
91.55 |
88.77 - 92.00 |
0.8856 times |
Tue 14 October 2025 |
92.23 (-0.02%) |
92.25 |
90.82 - 92.81 |
0.7515 times |
Mon 13 October 2025 |
92.25 (-0.24%) |
90.87 |
90.86 - 92.86 |
0.7371 times |
Fri 10 October 2025 |
92.47 (0.26%) |
92.71 |
91.81 - 93.00 |
0.7439 times |
Thu 09 October 2025 |
92.23 (-0.93%) |
93.11 |
91.86 - 93.62 |
0.5973 times |
Wed 08 October 2025 |
93.10 (-1.06%) |
94.67 |
92.83 - 94.81 |
0.6843 times |
Tue 07 October 2025 |
94.10 (3.01%) |
91.65 |
91.65 - 94.11 |
0.8884 times |
Weekly price and charts ArchCapital Strong weekly Stock price targets for ArchCapital ACGL are 86.85 and 88.91 | Weekly Target 1 | 85.19 | | Weekly Target 2 | 86.45 | | Weekly Target 3 | 87.253333333333 | | Weekly Target 4 | 88.51 | | Weekly Target 5 | 89.31 |
Weekly price and volumes for Arch Capital
| Date |
Closing |
Open |
Range |
Volume |
Tue 21 October 2025 |
87.70 (1.38%) |
87.11 |
86.00 - 88.06 |
0.4066 times |
Fri 17 October 2025 |
86.51 (-6.45%) |
90.87 |
85.93 - 92.86 |
1.8005 times |
Fri 10 October 2025 |
92.47 (1.85%) |
91.03 |
90.86 - 94.81 |
0.9755 times |
Fri 03 October 2025 |
90.79 (-0.1%) |
90.87 |
88.77 - 91.53 |
0.8226 times |
Fri 26 September 2025 |
90.88 (2.81%) |
88.34 |
87.58 - 91.58 |
1.347 times |
Fri 19 September 2025 |
88.40 (-4.18%) |
91.99 |
87.01 - 92.21 |
1.5425 times |
Fri 12 September 2025 |
92.26 (1.06%) |
93.50 |
88.70 - 93.50 |
1.138 times |
Fri 05 September 2025 |
91.29 (-0.26%) |
91.74 |
91.00 - 93.80 |
0.843 times |
Fri 29 August 2025 |
91.53 (0%) |
91.32 |
91.09 - 91.97 |
0.1792 times |
Fri 29 August 2025 |
91.53 (-2.01%) |
93.03 |
90.54 - 93.30 |
0.9451 times |
Fri 22 August 2025 |
93.41 (2.97%) |
90.66 |
90.00 - 94.51 |
0.8995 times |
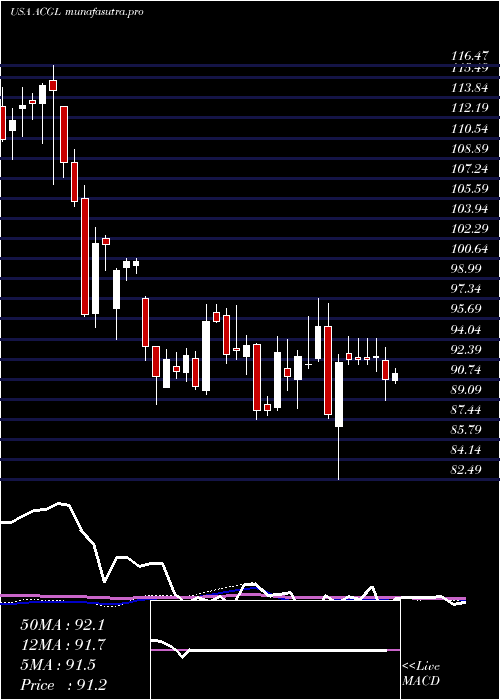
Monthly price and charts ArchCapital Strong monthly Stock price targets for ArchCapital ACGL are 82.38 and 91.26 | Monthly Target 1 | 80.6 | | Monthly Target 2 | 84.15 | | Monthly Target 3 | 89.48 | | Monthly Target 4 | 93.03 | | Monthly Target 5 | 98.36 |
Monthly price and volumes Arch Capital
| Date |
Closing |
Open |
Range |
Volume |
Tue 21 October 2025 |
87.70 (-3.34%) |
90.24 |
85.93 - 94.81 |
0.8177 times |
Tue 30 September 2025 |
90.73 (-0.87%) |
91.74 |
87.01 - 93.80 |
1.1625 times |
Fri 29 August 2025 |
91.53 (6.36%) |
86.38 |
86.29 - 94.51 |
1.0233 times |
Thu 31 July 2025 |
86.06 (-5.48%) |
91.40 |
84.81 - 91.96 |
1.6215 times |
Mon 30 June 2025 |
91.05 (-4.2%) |
94.61 |
88.95 - 96.79 |
0.7774 times |
Fri 30 May 2025 |
95.04 (4.81%) |
90.13 |
89.17 - 95.83 |
0.7864 times |
Wed 30 April 2025 |
90.68 (-5.72%) |
96.01 |
82.49 - 96.92 |
0.9269 times |
Mon 31 March 2025 |
96.18 (3.52%) |
91.61 |
88.34 - 97.40 |
0.7895 times |
Fri 28 February 2025 |
92.91 (-0.17%) |
92.57 |
87.42 - 94.30 |
0.9351 times |
Fri 31 January 2025 |
93.07 (0.78%) |
92.95 |
89.47 - 96.84 |
1.1598 times |
Tue 31 December 2024 |
92.35 (-8.03%) |
97.39 |
88.63 - 97.55 |
0.7126 times |

DMA SMA EMA moving averages of Arch Capital ACGL
DMA (daily moving average) of Arch Capital ACGL
| DMA period | DMA value | | 5 day DMA | 87.4 | | 12 day DMA | 90.39 | | 20 day DMA | 90.33 | | 35 day DMA | 90.18 | | 50 day DMA | 90.61 | | 100 day DMA | 90.31 | | 150 day DMA | 91.08 | | 200 day DMA | 91.28 | EMA (exponential moving average) of Arch Capital ACGL
| EMA period | EMA current | EMA prev | EMA prev2 | | 5 day EMA | 87.94 | 88.06 | 88.6 | | 12 day EMA | 89.21 | 89.49 | 89.95 | | 20 day EMA | 89.73 | 89.94 | 90.25 | | 35 day EMA | 90.17 | 90.32 | 90.52 | | 50 day EMA | 90.15 | 90.25 | 90.38 |
SMA (simple moving average) of Arch Capital ACGL
| SMA period | SMA current | SMA prev | SMA prev2 | | 5 day SMA | 87.4 | 88.3 | 89.36 | | 12 day SMA | 90.39 | 90.65 | 90.82 | | 20 day SMA | 90.33 | 90.37 | 90.42 | | 35 day SMA | 90.18 | 90.28 | 90.41 | | 50 day SMA | 90.61 | 90.61 | 90.67 | | 100 day SMA | 90.31 | 90.36 | 90.44 | | 150 day SMA | 91.08 | 91.11 | 91.14 | | 200 day SMA | 91.28 | 91.3 | 91.33 |
|
|
