ArcosaInc ACA full analysis,charts,indicators,moving averages,SMA,DMA,EMA,ADX,MACD,RSIArcosa Inc ACA WideScreen charts, DMA,SMA,EMA technical analysis, forecast prediction, by indicators ADX,MACD,RSI,CCI USA stock exchange
operates under Capital Goods sector & deals in Industrial Machinery Components
Daily price and charts and targets ArcosaInc Strong Daily Stock price targets for ArcosaInc ACA are 106.31 and 108.7 | Daily Target 1 | 104.43 | | Daily Target 2 | 105.8 | | Daily Target 3 | 106.82333333333 | | Daily Target 4 | 108.19 | | Daily Target 5 | 109.21 |
Daily price and volume Arcosa Inc
| Date |
Closing |
Open |
Range |
Volume |
Thu 04 December 2025 |
107.16 (0.12%) |
106.24 |
105.46 - 107.85 |
0.8005 times |
Wed 03 December 2025 |
107.03 (0.89%) |
106.21 |
103.57 - 108.09 |
1.1471 times |
Tue 02 December 2025 |
106.09 (0.29%) |
106.35 |
105.13 - 106.66 |
0.9272 times |
Mon 01 December 2025 |
105.78 (-0.71%) |
105.20 |
103.57 - 106.66 |
0.8573 times |
Fri 28 November 2025 |
106.54 (0.11%) |
106.39 |
105.81 - 106.90 |
0.4521 times |
Wed 26 November 2025 |
106.42 (0.23%) |
105.26 |
105.26 - 108.50 |
1.6712 times |
Tue 25 November 2025 |
106.18 (1.47%) |
104.00 |
104.00 - 107.13 |
1.0239 times |
Mon 24 November 2025 |
104.64 (2.13%) |
102.17 |
101.14 - 104.96 |
1.0708 times |
Fri 21 November 2025 |
102.46 (3.07%) |
100.02 |
99.32 - 102.96 |
0.9575 times |
Thu 20 November 2025 |
99.41 (-0.37%) |
101.73 |
99.06 - 103.44 |
1.0925 times |
Wed 19 November 2025 |
99.78 (1.33%) |
99.11 |
98.11 - 101.06 |
1.0977 times |
Weekly price and charts ArcosaInc Strong weekly Stock price targets for ArcosaInc ACA are 105.37 and 109.89 | Weekly Target 1 | 101.75 | | Weekly Target 2 | 104.46 | | Weekly Target 3 | 106.27333333333 | | Weekly Target 4 | 108.98 | | Weekly Target 5 | 110.79 |
Weekly price and volumes for Arcosa Inc
| Date |
Closing |
Open |
Range |
Volume |
Thu 04 December 2025 |
107.16 (0.58%) |
105.20 |
103.57 - 108.09 |
0.8956 times |
Fri 28 November 2025 |
106.54 (3.98%) |
102.17 |
101.14 - 108.50 |
1.0122 times |
Fri 21 November 2025 |
102.46 (1.97%) |
100.32 |
96.40 - 103.44 |
1.2447 times |
Fri 14 November 2025 |
100.48 (1.41%) |
100.18 |
98.30 - 102.48 |
1.2963 times |
Fri 07 November 2025 |
99.08 (-2.86%) |
101.43 |
96.99 - 102.32 |
0.8228 times |
Fri 31 October 2025 |
102.00 (0%) |
95.48 |
92.86 - 102.70 |
0.5288 times |
Fri 31 October 2025 |
102.00 (8.67%) |
94.35 |
91.40 - 102.70 |
1.2691 times |
Fri 24 October 2025 |
93.86 (0.66%) |
94.10 |
91.72 - 95.33 |
0.8278 times |
Fri 17 October 2025 |
93.24 (4.59%) |
90.32 |
89.13 - 93.40 |
1.0957 times |
Fri 10 October 2025 |
89.15 (-3.45%) |
92.88 |
89.03 - 93.41 |
1.0072 times |
Fri 03 October 2025 |
92.34 (-0.3%) |
92.86 |
91.27 - 94.00 |
0.9114 times |
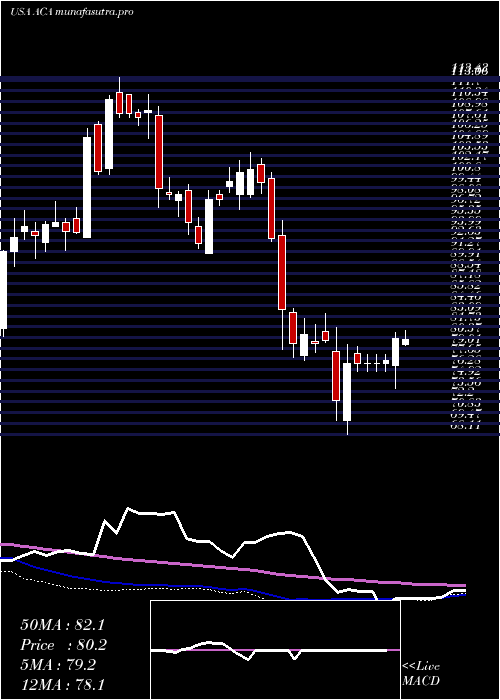
Monthly price and charts ArcosaInc Strong monthly Stock price targets for ArcosaInc ACA are 105.37 and 109.89 | Monthly Target 1 | 101.75 | | Monthly Target 2 | 104.46 | | Monthly Target 3 | 106.27333333333 | | Monthly Target 4 | 108.98 | | Monthly Target 5 | 110.79 |
Monthly price and volumes Arcosa Inc
| Date |
Closing |
Open |
Range |
Volume |
Thu 04 December 2025 |
107.16 (0.58%) |
105.20 |
103.57 - 108.09 |
0.1678 times |
Fri 28 November 2025 |
106.54 (4.45%) |
101.43 |
96.40 - 108.50 |
0.8198 times |
Fri 31 October 2025 |
102.00 (8.85%) |
93.32 |
89.03 - 102.70 |
0.9819 times |
Tue 30 September 2025 |
93.71 (-5.3%) |
97.14 |
91.07 - 99.16 |
0.8714 times |
Fri 29 August 2025 |
98.95 (15.22%) |
83.98 |
81.91 - 100.47 |
1.3031 times |
Thu 31 July 2025 |
85.88 (-0.96%) |
86.14 |
84.84 - 92.65 |
1.1483 times |
Mon 30 June 2025 |
86.71 (0.51%) |
86.06 |
84.14 - 90.73 |
0.9988 times |
Fri 30 May 2025 |
86.27 (7.74%) |
81.13 |
80.68 - 91.43 |
1.0246 times |
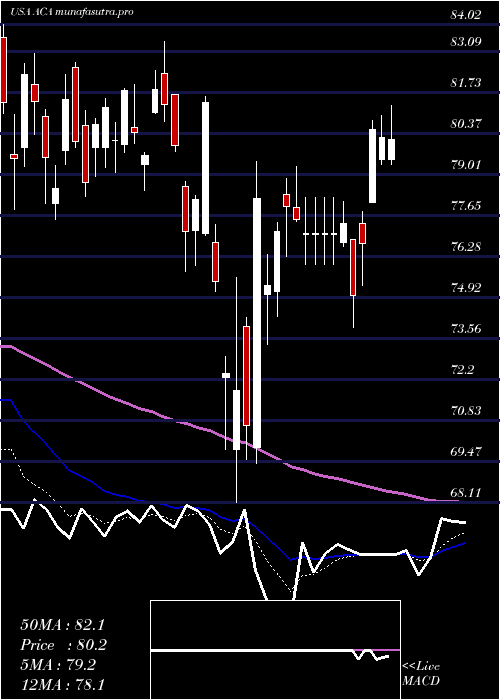
Wed 30 April 2025 |
80.07 (3.83%) |
77.15 |
68.11 - 81.60 |
1.2459 times |
Mon 31 March 2025 |
77.12 (-8.06%) |
83.57 |
75.78 - 84.02 |
1.4384 times |
Fri 28 February 2025 |
83.88 (-17.2%) |
98.55 |
78.86 - 103.84 |
0.9789 times |

DMA SMA EMA moving averages of Arcosa Inc ACA
DMA (daily moving average) of Arcosa Inc ACA
| DMA period | DMA value | | 5 day DMA | 106.52 | | 12 day DMA | 104.16 | | 20 day DMA | 102.36 | | 35 day DMA | 99.35 | | 50 day DMA | 97.14 | | 100 day DMA | 95.56 | | 150 day DMA | 92.88 | | 200 day DMA | 89.88 | EMA (exponential moving average) of Arcosa Inc ACA
| EMA period | EMA current | EMA prev | EMA prev2 | | 5 day EMA | 106.42 | 106.05 | 105.56 | | 12 day EMA | 104.64 | 104.18 | 103.66 | | 20 day EMA | 102.89 | 102.44 | 101.96 | | 35 day EMA | 100.34 | 99.94 | 99.52 | | 50 day EMA | 97.96 | 97.58 | 97.19 |
SMA (simple moving average) of Arcosa Inc ACA
| SMA period | SMA current | SMA prev | SMA prev2 | | 5 day SMA | 106.52 | 106.37 | 106.2 | | 12 day SMA | 104.16 | 103.39 | 102.84 | | 20 day SMA | 102.36 | 102.03 | 101.69 | | 35 day SMA | 99.35 | 98.94 | 98.54 | | 50 day SMA | 97.14 | 96.87 | 96.65 | | 100 day SMA | 95.56 | 95.36 | 95.19 | | 150 day SMA | 92.88 | 92.7 | 92.52 | | 200 day SMA | 89.88 | 89.85 | 89.81 |
|
|
