ArborRealty ABR full analysis,charts,indicators,moving averages,SMA,DMA,EMA,ADX,MACD,RSIArbor Realty ABR WideScreen charts, DMA,SMA,EMA technical analysis, forecast prediction, by indicators ADX,MACD,RSI,CCI USA stock exchange
operates under Consumer Services sector & deals in Real Estate Investment Trusts
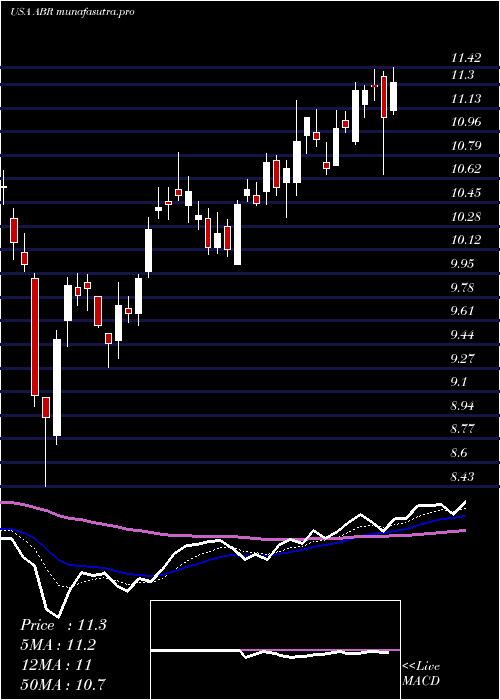
Daily price and charts and targets ArborRealty Strong Daily Stock price targets for ArborRealty ABR are 11.74 and 12.04 | Daily Target 1 | 11.49 | | Daily Target 2 | 11.69 | | Daily Target 3 | 11.793333333333 | | Daily Target 4 | 11.99 | | Daily Target 5 | 12.09 |
Daily price and volume Arbor Realty
| Date |
Closing |
Open |
Range |
Volume |
Mon 20 October 2025 |
11.88 (2.06%) |
11.64 |
11.60 - 11.90 |
0.8692 times |
Fri 17 October 2025 |
11.64 (-1.94%) |
11.81 |
11.32 - 11.90 |
1.0623 times |
Thu 16 October 2025 |
11.87 (-0.08%) |
11.90 |
11.76 - 12.18 |
1.3376 times |
Wed 15 October 2025 |
11.88 (0.68%) |
11.81 |
11.81 - 12.05 |
0.8676 times |
Tue 14 October 2025 |
11.80 (1.55%) |
11.54 |
11.51 - 11.88 |
0.7941 times |
Mon 13 October 2025 |
11.62 (2.02%) |
11.45 |
11.37 - 11.63 |
0.8409 times |
Fri 10 October 2025 |
11.39 (-1.13%) |
11.50 |
11.38 - 11.71 |
1.044 times |
Thu 09 October 2025 |
11.52 (-4.71%) |
12.12 |
11.47 - 12.12 |
1.3827 times |
Wed 08 October 2025 |
12.09 (0%) |
12.21 |
12.01 - 12.21 |
0.8266 times |
Tue 07 October 2025 |
12.09 (-2.42%) |
12.28 |
12.06 - 12.36 |
0.9749 times |
Mon 06 October 2025 |
12.39 (0.08%) |
12.48 |
12.25 - 12.49 |
0.7756 times |
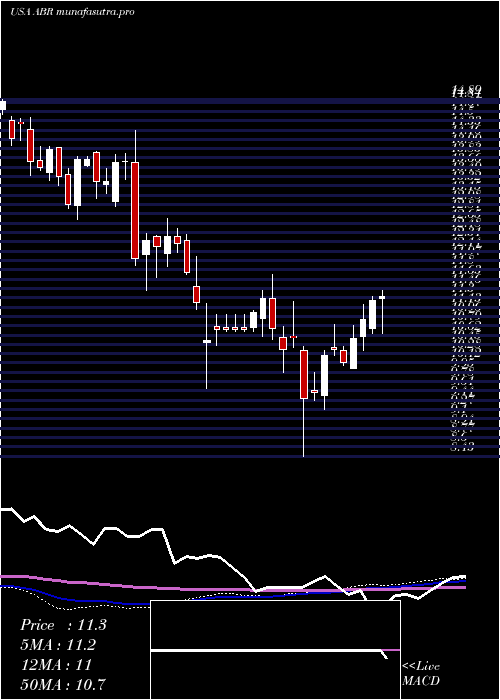
Weekly price and charts ArborRealty Strong weekly Stock price targets for ArborRealty ABR are 11.74 and 12.04 | Weekly Target 1 | 11.49 | | Weekly Target 2 | 11.69 | | Weekly Target 3 | 11.793333333333 | | Weekly Target 4 | 11.99 | | Weekly Target 5 | 12.09 |
Weekly price and volumes for Arbor Realty
| Date |
Closing |
Open |
Range |
Volume |
Mon 20 October 2025 |
11.88 (2.06%) |
11.64 |
11.60 - 11.90 |
0.206 times |
Fri 17 October 2025 |
11.64 (2.19%) |
11.45 |
11.32 - 12.18 |
1.1617 times |
Fri 10 October 2025 |
11.39 (-8%) |
12.48 |
11.38 - 12.49 |
1.1858 times |
Fri 03 October 2025 |
12.38 (2.74%) |
12.07 |
11.93 - 12.58 |
1.1405 times |
Fri 26 September 2025 |
12.05 (1.52%) |
11.87 |
11.68 - 12.10 |
1.4024 times |
Fri 19 September 2025 |
11.87 (1.45%) |
11.76 |
11.50 - 12.00 |
1.574 times |
Fri 12 September 2025 |
11.70 (-3.86%) |
12.15 |
11.68 - 12.15 |
1.0006 times |
Fri 05 September 2025 |
12.17 (1.93%) |
11.62 |
11.52 - 12.28 |
0.9959 times |
Fri 29 August 2025 |
11.94 (0%) |
11.75 |
11.74 - 11.94 |
0.2501 times |
Fri 29 August 2025 |
11.94 (0.93%) |
11.77 |
11.69 - 11.94 |
1.083 times |
Fri 22 August 2025 |
11.83 (1.98%) |
11.57 |
11.31 - 11.94 |
1.3678 times |
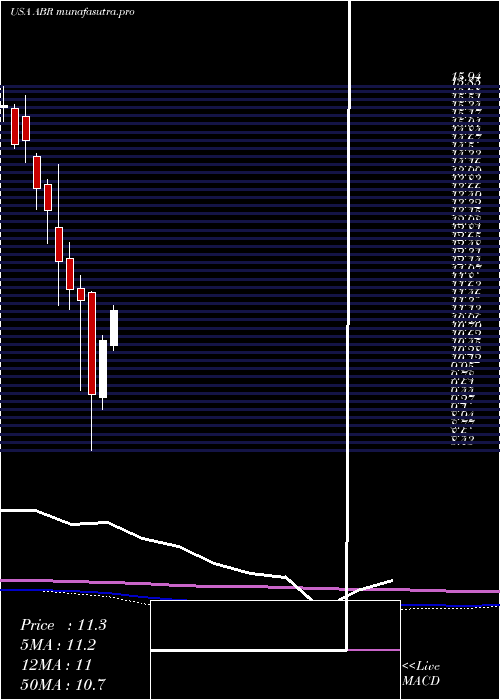
Monthly price and charts ArborRealty Strong monthly Stock price targets for ArborRealty ABR are 10.97 and 12.23 | Monthly Target 1 | 10.67 | | Monthly Target 2 | 11.27 | | Monthly Target 3 | 11.926666666667 | | Monthly Target 4 | 12.53 | | Monthly Target 5 | 13.19 |
Monthly price and volumes Arbor Realty
| Date |
Closing |
Open |
Range |
Volume |
Mon 20 October 2025 |
11.88 (-2.7%) |
12.20 |
11.32 - 12.58 |
0.4457 times |
Tue 30 September 2025 |
12.21 (2.26%) |
11.62 |
11.50 - 12.28 |
0.7334 times |
Fri 29 August 2025 |
11.94 (6.99%) |
11.25 |
10.95 - 12.19 |
0.84 times |
Thu 31 July 2025 |
11.16 (4.3%) |
10.60 |
10.50 - 12.22 |
0.8854 times |
Mon 30 June 2025 |
10.70 (11.69%) |
9.52 |
9.28 - 10.81 |
0.9201 times |
Fri 30 May 2025 |
9.58 (-16.91%) |
11.69 |
8.43 - 11.71 |
1.7296 times |
Wed 30 April 2025 |
11.53 (-1.87%) |
11.77 |
9.66 - 12.05 |
1.1711 times |
Mon 31 March 2025 |
11.75 (-4.78%) |
12.40 |
11.35 - 12.73 |
1.1278 times |
Fri 28 February 2025 |
12.34 (-7.84%) |
13.03 |
11.43 - 14.33 |
1.3506 times |
Fri 31 January 2025 |
13.39 (-3.32%) |
13.92 |
12.71 - 14.03 |
0.7963 times |
Tue 31 December 2024 |
13.85 (-6.67%) |
14.51 |
13.41 - 14.57 |
0.5119 times |
DMA SMA EMA moving averages of Arbor Realty ABR
DMA (daily moving average) of Arbor Realty ABR
| DMA period | DMA value | | 5 day DMA | 11.81 | | 12 day DMA | 11.88 | | 20 day DMA | 11.96 | | 35 day DMA | 11.89 | | 50 day DMA | 11.85 | | 100 day DMA | 11.37 | | 150 day DMA | 11.22 | | 200 day DMA | 11.69 | EMA (exponential moving average) of Arbor Realty ABR
| EMA period | EMA current | EMA prev | EMA prev2 | | 5 day EMA | 11.8 | 11.76 | 11.82 | | 12 day EMA | 11.84 | 11.83 | 11.87 | | 20 day EMA | 11.87 | 11.87 | 11.89 | | 35 day EMA | 11.88 | 11.88 | 11.89 | | 50 day EMA | 11.84 | 11.84 | 11.85 |
SMA (simple moving average) of Arbor Realty ABR
| SMA period | SMA current | SMA prev | SMA prev2 | | 5 day SMA | 11.81 | 11.76 | 11.71 | | 12 day SMA | 11.88 | 11.91 | 11.97 | | 20 day SMA | 11.96 | 11.95 | 11.97 | | 35 day SMA | 11.89 | 11.89 | 11.9 | | 50 day SMA | 11.85 | 11.85 | 11.86 | | 100 day SMA | 11.37 | 11.35 | 11.33 | | 150 day SMA | 11.22 | 11.23 | 11.23 | | 200 day SMA | 11.69 | 11.7 | 11.71 |
|
|
