AbmIndustries ABM full analysis,charts,indicators,moving averages,SMA,DMA,EMA,ADX,MACD,RSIAbm Industries ABM WideScreen charts, DMA,SMA,EMA technical analysis, forecast prediction, by indicators ADX,MACD,RSI,CCI USA stock exchange
operates under Finance sector & deals in Diversified Commercial Services
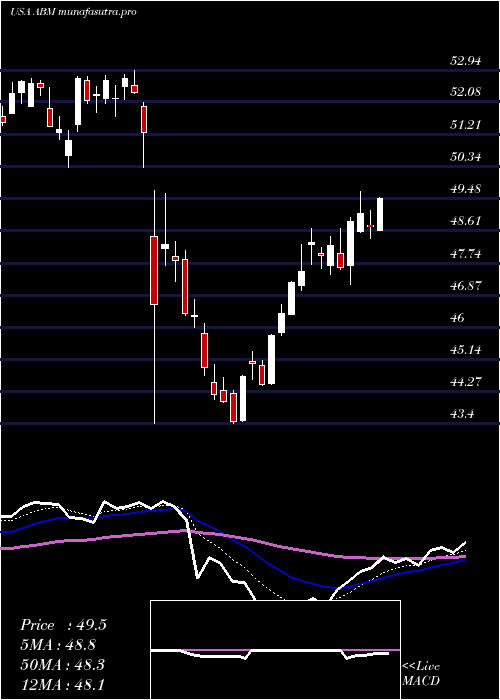
Daily price and charts and targets AbmIndustries Strong Daily Stock price targets for AbmIndustries ABM are 43.99 and 44.81 | Daily Target 1 | 43.34 | | Daily Target 2 | 43.82 | | Daily Target 3 | 44.163333333333 | | Daily Target 4 | 44.64 | | Daily Target 5 | 44.98 |
Daily price and volume Abm Industries
| Date |
Closing |
Open |
Range |
Volume |
Thu 04 December 2025 |
44.29 (0.8%) |
44.03 |
43.69 - 44.51 |
0.7955 times |
Wed 03 December 2025 |
43.94 (1.67%) |
43.47 |
43.38 - 44.22 |
1.1923 times |
Tue 02 December 2025 |
43.22 (0.32%) |
43.33 |
42.51 - 43.33 |
1.2093 times |
Mon 01 December 2025 |
43.08 (0.19%) |
42.69 |
42.69 - 43.53 |
0.7709 times |
Fri 28 November 2025 |
43.00 (0.05%) |
43.19 |
42.89 - 43.25 |
0.27 times |
Wed 26 November 2025 |
42.98 (0.09%) |
42.63 |
42.63 - 43.52 |
1.346 times |
Tue 25 November 2025 |
42.94 (2.19%) |
42.19 |
42.19 - 43.26 |
0.9763 times |
Mon 24 November 2025 |
42.02 (-0.43%) |
42.06 |
41.56 - 42.20 |
1.1476 times |
Fri 21 November 2025 |
42.20 (1.32%) |
41.95 |
41.64 - 42.74 |
1.2859 times |
Thu 20 November 2025 |
41.65 (2.89%) |
40.94 |
40.29 - 41.79 |
1.0062 times |
Wed 19 November 2025 |
40.48 (-0.02%) |
40.73 |
40.00 - 40.77 |
0.8964 times |
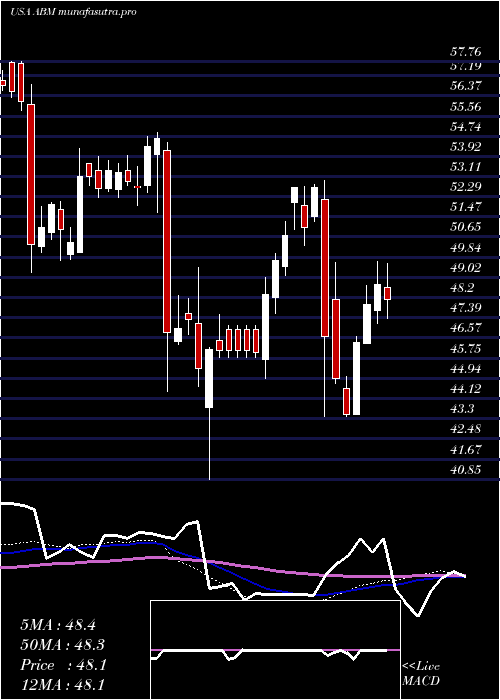
Weekly price and charts AbmIndustries Strong weekly Stock price targets for AbmIndustries ABM are 43.4 and 45.4 | Weekly Target 1 | 41.77 | | Weekly Target 2 | 43.03 | | Weekly Target 3 | 43.77 | | Weekly Target 4 | 45.03 | | Weekly Target 5 | 45.77 |
Weekly price and volumes for Abm Industries
| Date |
Closing |
Open |
Range |
Volume |
Thu 04 December 2025 |
44.29 (3%) |
42.69 |
42.51 - 44.51 |
0.923 times |
Fri 28 November 2025 |
43.00 (1.9%) |
42.06 |
41.56 - 43.52 |
0.8699 times |
Fri 21 November 2025 |
42.20 (0.31%) |
41.99 |
40.00 - 42.74 |
1.1734 times |
Fri 14 November 2025 |
42.07 (0.29%) |
42.21 |
41.44 - 42.72 |
1.4427 times |
Fri 07 November 2025 |
41.95 (-2.44%) |
43.29 |
41.68 - 43.86 |
0.9747 times |
Fri 31 October 2025 |
43.00 (0%) |
42.65 |
42.10 - 43.05 |
0.255 times |
Fri 31 October 2025 |
43.00 (-5.89%) |
45.95 |
42.10 - 46.07 |
1.1165 times |
Fri 24 October 2025 |
45.69 (1.4%) |
45.07 |
45.06 - 46.06 |
1.1709 times |
Fri 17 October 2025 |
45.06 (1.37%) |
44.70 |
44.34 - 45.80 |
1.0762 times |
Fri 10 October 2025 |
44.45 (-4.55%) |
46.33 |
44.38 - 46.72 |
0.9978 times |
Fri 03 October 2025 |
46.57 (1.73%) |
46.02 |
45.14 - 47.16 |
1.0248 times |
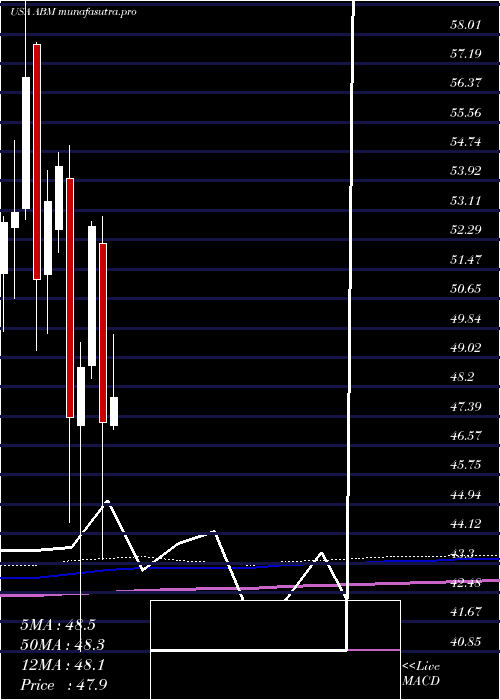
Monthly price and charts AbmIndustries Strong monthly Stock price targets for AbmIndustries ABM are 43.4 and 45.4 | Monthly Target 1 | 41.77 | | Monthly Target 2 | 43.03 | | Monthly Target 3 | 43.77 | | Monthly Target 4 | 45.03 | | Monthly Target 5 | 45.77 |
Monthly price and volumes Abm Industries
| Date |
Closing |
Open |
Range |
Volume |
Thu 04 December 2025 |
44.29 (3%) |
42.69 |
42.51 - 44.51 |
0.181 times |
Fri 28 November 2025 |
43.00 (0%) |
43.29 |
40.00 - 43.86 |
0.8745 times |
Fri 31 October 2025 |
43.00 (-6.76%) |
45.83 |
42.10 - 47.16 |
1.0389 times |
Tue 30 September 2025 |
46.12 (-6.2%) |
48.78 |
44.06 - 49.14 |
1.4675 times |
Fri 29 August 2025 |
49.17 (6.59%) |
45.62 |
45.29 - 49.94 |
0.8514 times |
Thu 31 July 2025 |
46.13 (-2.29%) |
47.13 |
45.92 - 49.66 |
1.0475 times |
Mon 30 June 2025 |
47.21 (-10.33%) |
52.18 |
43.40 - 52.94 |
1.3625 times |
Fri 30 May 2025 |
52.65 (8.02%) |
48.80 |
48.42 - 52.80 |
0.6329 times |
Wed 30 April 2025 |
48.74 (2.91%) |
47.13 |
40.85 - 49.42 |
1.4093 times |
Mon 31 March 2025 |
47.36 (-12.83%) |
54.00 |
44.42 - 54.90 |
1.1346 times |
Fri 28 February 2025 |
54.33 (1.82%) |
52.56 |
51.92 - 54.72 |
0.5085 times |
DMA SMA EMA moving averages of Abm Industries ABM
DMA (daily moving average) of Abm Industries ABM
| DMA period | DMA value | | 5 day DMA | 43.51 | | 12 day DMA | 42.52 | | 20 day DMA | 42.31 | | 35 day DMA | 43.22 | | 50 day DMA | 43.96 | | 100 day DMA | 45.69 | | 150 day DMA | 46.83 | | 200 day DMA | 47.23 | EMA (exponential moving average) of Abm Industries ABM
| EMA period | EMA current | EMA prev | EMA prev2 | | 5 day EMA | 43.6 | 43.26 | 42.92 | | 12 day EMA | 43.01 | 42.78 | 42.57 | | 20 day EMA | 42.94 | 42.8 | 42.68 | | 35 day EMA | 43.36 | 43.3 | 43.26 | | 50 day EMA | 44.04 | 44.03 | 44.03 |
SMA (simple moving average) of Abm Industries ABM
| SMA period | SMA current | SMA prev | SMA prev2 | | 5 day SMA | 43.51 | 43.24 | 43.04 | | 12 day SMA | 42.52 | 42.19 | 42.04 | | 20 day SMA | 42.31 | 42.28 | 42.23 | | 35 day SMA | 43.22 | 43.25 | 43.29 | | 50 day SMA | 43.96 | 43.98 | 44 | | 100 day SMA | 45.69 | 45.73 | 45.78 | | 150 day SMA | 46.83 | 46.86 | 46.89 | | 200 day SMA | 47.23 | 47.27 | 47.32 |
|
|
