AsburyAutomotive ABG full analysis,charts,indicators,moving averages,SMA,DMA,EMA,ADX,MACD,RSIAsbury Automotive ABG WideScreen charts, DMA,SMA,EMA technical analysis, forecast prediction, by indicators ADX,MACD,RSI,CCI USA stock exchange
operates under Consumer Durables sector & deals in Automotive Aftermarket
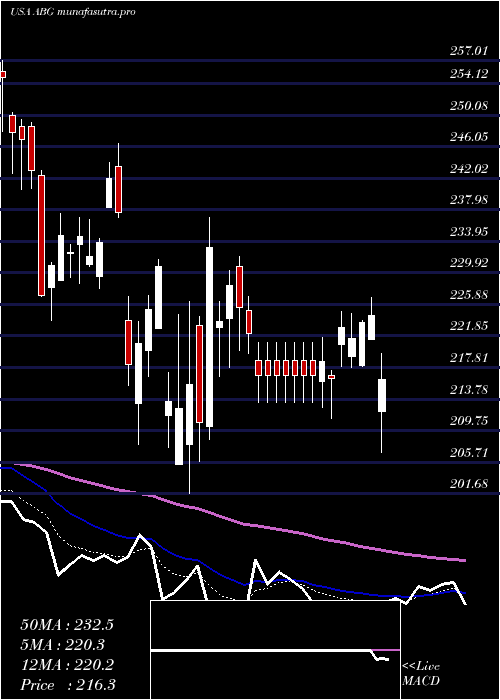
Daily price and charts and targets AsburyAutomotive Strong Daily Stock price targets for AsburyAutomotive ABG are 232.22 and 238.45 | Daily Target 1 | 227.51 | | Daily Target 2 | 230.7 | | Daily Target 3 | 233.73666666667 | | Daily Target 4 | 236.93 | | Daily Target 5 | 239.97 |
Daily price and volume Asbury Automotive
| Date |
Closing |
Open |
Range |
Volume |
Thu 04 December 2025 |
233.90 (-0.99%) |
233.58 |
230.54 - 236.77 |
0.7956 times |
Wed 03 December 2025 |
236.23 (2.49%) |
230.67 |
230.56 - 240.14 |
1.0329 times |
Tue 02 December 2025 |
230.48 (-0.71%) |
235.17 |
229.99 - 235.17 |
0.9281 times |
Mon 01 December 2025 |
232.12 (-0.19%) |
230.77 |
228.84 - 235.13 |
0.7048 times |
Fri 28 November 2025 |
232.57 (-0.82%) |
233.31 |
231.67 - 235.51 |
0.4189 times |
Wed 26 November 2025 |
234.50 (0.38%) |
235.00 |
234.24 - 241.97 |
1.504 times |
Tue 25 November 2025 |
233.62 (4.39%) |
224.53 |
224.53 - 237.04 |
1.0667 times |
Mon 24 November 2025 |
223.80 (0.39%) |
223.77 |
221.10 - 227.39 |
0.9538 times |
Fri 21 November 2025 |
222.93 (5.68%) |
212.74 |
212.74 - 223.97 |
1.166 times |
Thu 20 November 2025 |
210.94 (-3.88%) |
222.97 |
210.67 - 224.71 |
1.4292 times |
Wed 19 November 2025 |
219.45 (-0.39%) |
219.13 |
218.24 - 222.55 |
0.925 times |
Weekly price and charts AsburyAutomotive Strong weekly Stock price targets for AsburyAutomotive ABG are 231.37 and 242.67 | Weekly Target 1 | 222.99 | | Weekly Target 2 | 228.45 | | Weekly Target 3 | 234.29333333333 | | Weekly Target 4 | 239.75 | | Weekly Target 5 | 245.59 |
Weekly price and volumes for Asbury Automotive
| Date |
Closing |
Open |
Range |
Volume |
Thu 04 December 2025 |
233.90 (0.57%) |
230.77 |
228.84 - 240.14 |
0.7744 times |
Fri 28 November 2025 |
232.57 (4.32%) |
223.77 |
221.10 - 241.97 |
0.8822 times |
Fri 21 November 2025 |
222.93 (0.38%) |
220.10 |
210.67 - 224.71 |
1.1073 times |
Fri 14 November 2025 |
222.09 (-1.99%) |
230.10 |
216.34 - 230.10 |
1.0599 times |
Fri 07 November 2025 |
226.61 (-3.41%) |
232.86 |
223.96 - 235.51 |
1.0074 times |
Fri 31 October 2025 |
234.60 (0%) |
235.98 |
234.11 - 239.52 |
0.2812 times |
Fri 31 October 2025 |
234.60 (-1.98%) |
239.48 |
229.64 - 248.04 |
2.0233 times |
Fri 24 October 2025 |
239.33 (-1.81%) |
244.59 |
238.00 - 252.89 |
0.7644 times |
Fri 17 October 2025 |
243.74 (3.69%) |
235.87 |
235.37 - 251.17 |
1.1752 times |
Fri 10 October 2025 |
235.06 (-7.23%) |
255.82 |
234.01 - 255.82 |
0.9248 times |
Fri 03 October 2025 |
253.39 (6.02%) |
241.49 |
236.09 - 257.80 |
1.2017 times |
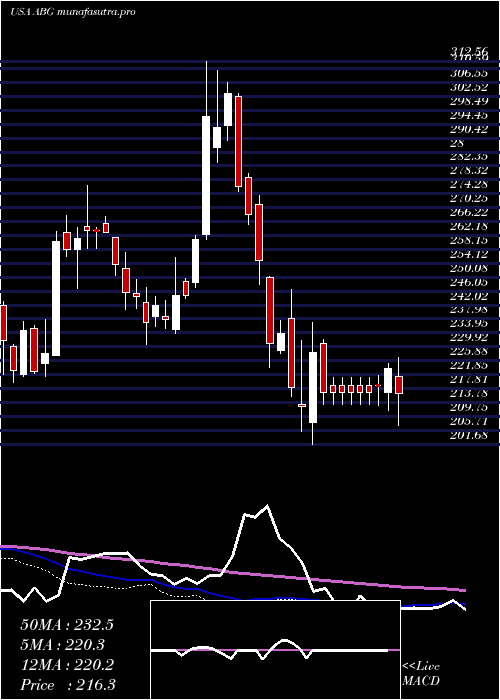
Monthly price and charts AsburyAutomotive Strong monthly Stock price targets for AsburyAutomotive ABG are 231.37 and 242.67 | Monthly Target 1 | 222.99 | | Monthly Target 2 | 228.45 | | Monthly Target 3 | 234.29333333333 | | Monthly Target 4 | 239.75 | | Monthly Target 5 | 245.59 |
Monthly price and volumes Asbury Automotive
| Date |
Closing |
Open |
Range |
Volume |
Thu 04 December 2025 |
233.90 (0.57%) |
230.77 |
228.84 - 240.14 |
0.158 times |
Fri 28 November 2025 |
232.57 (-0.87%) |
232.86 |
210.67 - 241.97 |
0.8278 times |
Fri 31 October 2025 |
234.60 (-4.03%) |
243.32 |
229.64 - 257.80 |
1.1883 times |
Tue 30 September 2025 |
244.45 (-2.82%) |
246.25 |
228.20 - 262.67 |
0.8531 times |
Fri 29 August 2025 |
251.54 (13.25%) |
218.94 |
218.35 - 263.38 |
1.0049 times |
Thu 31 July 2025 |
222.12 (-6.88%) |
236.76 |
212.85 - 274.50 |
1.3053 times |
Mon 30 June 2025 |
238.54 (4.66%) |
226.20 |
224.37 - 246.83 |
0.8086 times |
Fri 30 May 2025 |
227.91 (4.48%) |
220.68 |
216.19 - 241.96 |
0.7811 times |
Wed 30 April 2025 |
218.14 (-1.22%) |
220.00 |
201.68 - 236.97 |
1.8426 times |
Mon 31 March 2025 |
220.84 (-17.72%) |
271.11 |
207.96 - 273.69 |
1.2303 times |
Fri 28 February 2025 |
268.40 (-9.53%) |
287.78 |
265.41 - 309.99 |
0.8817 times |

DMA SMA EMA moving averages of Asbury Automotive ABG
DMA (daily moving average) of Asbury Automotive ABG
| DMA period | DMA value | | 5 day DMA | 233.06 | | 12 day DMA | 227.57 | | 20 day DMA | 225.58 | | 35 day DMA | 231.59 | | 50 day DMA | 235.47 | | 100 day DMA | 238.21 | | 150 day DMA | 237.94 | | 200 day DMA | 236.69 | EMA (exponential moving average) of Asbury Automotive ABG
| EMA period | EMA current | EMA prev | EMA prev2 | | 5 day EMA | 232.89 | 232.39 | 230.47 | | 12 day EMA | 230.03 | 229.33 | 228.07 | | 20 day EMA | 229.6 | 229.15 | 228.4 | | 35 day EMA | 231.8 | 231.68 | 231.41 | | 50 day EMA | 235.79 | 235.87 | 235.86 |
SMA (simple moving average) of Asbury Automotive ABG
| SMA period | SMA current | SMA prev | SMA prev2 | | 5 day SMA | 233.06 | 233.18 | 232.66 | | 12 day SMA | 227.57 | 226.14 | 224.97 | | 20 day SMA | 225.58 | 225.58 | 225.29 | | 35 day SMA | 231.59 | 232 | 232.29 | | 50 day SMA | 235.47 | 235.64 | 235.76 | | 100 day SMA | 238.21 | 238.35 | 238.62 | | 150 day SMA | 237.94 | 237.83 | 237.7 | | 200 day SMA | 236.69 | 236.9 | 237.16 |
|
|
