AmerisBancorp ABCB full analysis,charts,indicators,moving averages,SMA,DMA,EMA,ADX,MACD,RSIAmeris Bancorp ABCB WideScreen charts, DMA,SMA,EMA technical analysis, forecast prediction, by indicators ADX,MACD,RSI,CCI USA stock exchange
operates under Finance sector & deals in Major Banks
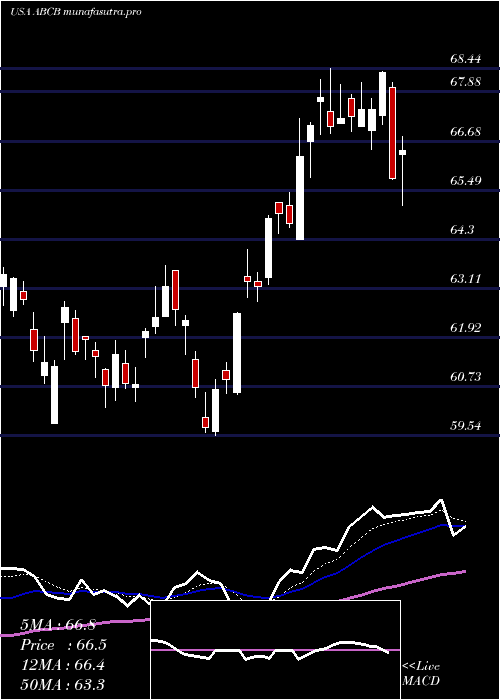
Daily price and charts and targets AmerisBancorp Strong Daily Stock price targets for AmerisBancorp ABCB are 71.77 and 73.73 | Daily Target 1 | 70.19 | | Daily Target 2 | 71.39 | | Daily Target 3 | 72.15 | | Daily Target 4 | 73.35 | | Daily Target 5 | 74.11 |
Daily price and volume Ameris Bancorp
| Date |
Closing |
Open |
Range |
Volume |
Mon 20 October 2025 |
72.59 (2.51%) |
71.09 |
70.95 - 72.91 |
0.8098 times |
Fri 17 October 2025 |
70.81 (2.02%) |
70.26 |
69.09 - 71.03 |
0.8618 times |
Thu 16 October 2025 |
69.41 (-5.82%) |
73.28 |
68.80 - 73.64 |
1.8453 times |
Wed 15 October 2025 |
73.70 (-1.55%) |
76.00 |
73.13 - 76.00 |
0.7347 times |
Tue 14 October 2025 |
74.86 (3.23%) |
72.14 |
72.14 - 75.33 |
0.8104 times |
Mon 13 October 2025 |
72.52 (1.91%) |
72.02 |
71.43 - 72.81 |
0.7068 times |
Fri 10 October 2025 |
71.16 (-3.69%) |
74.24 |
71.08 - 75.36 |
1.3993 times |
Thu 09 October 2025 |
73.89 (-0.4%) |
74.26 |
73.38 - 74.27 |
0.7646 times |
Wed 08 October 2025 |
74.19 (-0.12%) |
74.77 |
73.68 - 74.77 |
0.9971 times |
Tue 07 October 2025 |
74.28 (-0.8%) |
75.12 |
73.87 - 75.37 |
1.0701 times |
Mon 06 October 2025 |
74.88 (1.48%) |
74.54 |
73.84 - 76.03 |
0.585 times |
Weekly price and charts AmerisBancorp Strong weekly Stock price targets for AmerisBancorp ABCB are 71.77 and 73.73 | Weekly Target 1 | 70.19 | | Weekly Target 2 | 71.39 | | Weekly Target 3 | 72.15 | | Weekly Target 4 | 73.35 | | Weekly Target 5 | 74.11 |
Weekly price and volumes for Ameris Bancorp
| Date |
Closing |
Open |
Range |
Volume |
Mon 20 October 2025 |
72.59 (2.51%) |
71.09 |
70.95 - 72.91 |
0.2141 times |
Fri 17 October 2025 |
70.81 (-0.49%) |
72.02 |
68.80 - 76.00 |
1.3112 times |
Fri 10 October 2025 |
71.16 (-3.56%) |
74.54 |
71.08 - 76.03 |
1.2735 times |
Fri 03 October 2025 |
73.79 (-1.43%) |
74.91 |
72.15 - 74.91 |
0.9748 times |
Fri 26 September 2025 |
74.86 (-1.38%) |
75.35 |
74.20 - 76.52 |
1.1738 times |
Fri 19 September 2025 |
75.91 (2.06%) |
74.43 |
72.90 - 76.58 |
1.9011 times |
Fri 12 September 2025 |
74.38 (0.47%) |
74.14 |
72.86 - 74.90 |
1.1645 times |
Fri 05 September 2025 |
74.03 (1.02%) |
72.20 |
71.98 - 75.46 |
0.7074 times |
Fri 29 August 2025 |
73.28 (0%) |
73.63 |
72.93 - 74.00 |
0.2042 times |
Fri 29 August 2025 |
73.28 (1.72%) |
71.75 |
71.64 - 74.38 |
1.0754 times |
Fri 22 August 2025 |
72.04 (2.96%) |
69.78 |
68.92 - 72.62 |
1.2981 times |
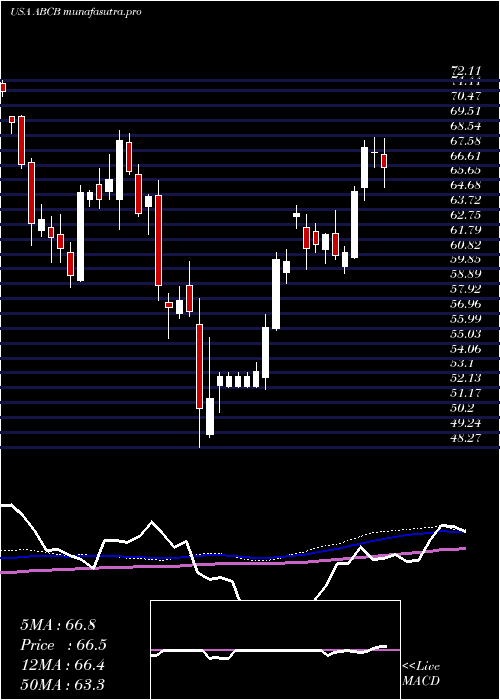
Monthly price and charts AmerisBancorp Strong monthly Stock price targets for AmerisBancorp ABCB are 67.08 and 74.31 | Monthly Target 1 | 65.24 | | Monthly Target 2 | 68.92 | | Monthly Target 3 | 72.473333333333 | | Monthly Target 4 | 76.15 | | Monthly Target 5 | 79.7 |
Monthly price and volumes Ameris Bancorp
| Date |
Closing |
Open |
Range |
Volume |
Mon 20 October 2025 |
72.59 (-0.98%) |
72.72 |
68.80 - 76.03 |
0.6697 times |
Tue 30 September 2025 |
73.31 (0.04%) |
72.20 |
71.98 - 76.58 |
1.0882 times |
Fri 29 August 2025 |
73.28 (7.21%) |
67.33 |
65.43 - 74.38 |
1.0334 times |
Thu 31 July 2025 |
68.35 (5.64%) |
64.30 |
64.30 - 70.43 |
1.1898 times |
Mon 30 June 2025 |
64.70 (5.25%) |
61.14 |
59.54 - 65.43 |
0.7471 times |
Fri 30 May 2025 |
61.47 (4.9%) |
58.47 |
58.04 - 63.97 |
0.8923 times |
Wed 30 April 2025 |
58.60 (1.79%) |
56.82 |
48.27 - 59.49 |
1.3105 times |
Mon 31 March 2025 |
57.57 (-10.85%) |
64.65 |
55.32 - 65.64 |
1.2183 times |
Fri 28 February 2025 |
64.58 (-1.63%) |
64.40 |
62.13 - 68.85 |
0.7942 times |
Fri 31 January 2025 |
65.65 (4.92%) |
63.01 |
58.65 - 67.27 |
1.0564 times |
Tue 31 December 2024 |
62.57 (-12.33%) |
69.80 |
61.37 - 69.87 |
0.8207 times |
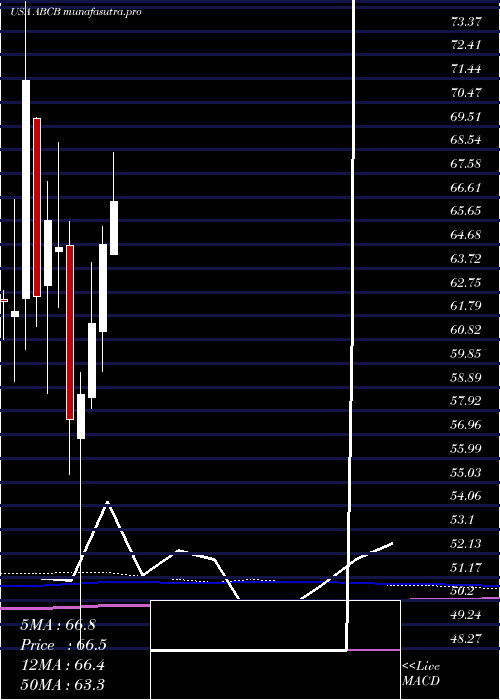
DMA SMA EMA moving averages of Ameris Bancorp ABCB
DMA (daily moving average) of Ameris Bancorp ABCB
| DMA period | DMA value | | 5 day DMA | 72.27 | | 12 day DMA | 73.01 | | 20 day DMA | 73.46 | | 35 day DMA | 73.79 | | 50 day DMA | 73.11 | | 100 day DMA | 69.01 | | 150 day DMA | 65.1 | | 200 day DMA | 64.65 | EMA (exponential moving average) of Ameris Bancorp ABCB
| EMA period | EMA current | EMA prev | EMA prev2 | | 5 day EMA | 72.02 | 71.74 | 72.21 | | 12 day EMA | 72.67 | 72.69 | 73.03 | | 20 day EMA | 73.01 | 73.05 | 73.29 | | 35 day EMA | 72.78 | 72.79 | 72.91 | | 50 day EMA | 72.49 | 72.49 | 72.56 |
SMA (simple moving average) of Ameris Bancorp ABCB
| SMA period | SMA current | SMA prev | SMA prev2 | | 5 day SMA | 72.27 | 72.26 | 72.33 | | 12 day SMA | 73.01 | 73.06 | 73.24 | | 20 day SMA | 73.46 | 73.59 | 73.85 | | 35 day SMA | 73.79 | 73.81 | 73.88 | | 50 day SMA | 73.11 | 73 | 72.92 | | 100 day SMA | 69.01 | 68.91 | 68.81 | | 150 day SMA | 65.1 | 65.01 | 64.92 | | 200 day SMA | 64.65 | 64.6 | 64.55 |
|
|
