AppleInc AAPL full analysis,charts,indicators,moving averages,SMA,DMA,EMA,ADX,MACD,RSIApple Inc AAPL WideScreen charts, DMA,SMA,EMA technical analysis, forecast prediction, by indicators ADX,MACD,RSI,CCI USA stock exchange
operates under Technology sector & deals in Computer Manufacturing
Daily price and charts and targets AppleInc Strong Daily Stock price targets for AppleInc AAPL are 276.78 and 280.08 | Daily Target 1 | 276.1 | | Daily Target 2 | 277.45 | | Daily Target 3 | 279.4 | | Daily Target 4 | 280.75 | | Daily Target 5 | 282.7 |
Daily price and volume Apple Inc
| Date |
Closing |
Open |
Range |
Volume |
Fri 05 December 2025 |
278.80 (-0.66%) |
281.00 |
278.05 - 281.35 |
0.5757 times |
Thu 04 December 2025 |
280.65 (-1.23%) |
283.78 |
278.59 - 284.73 |
0.7441 times |
Wed 03 December 2025 |
284.15 (-0.73%) |
286.20 |
283.30 - 288.62 |
1.4351 times |
Tue 02 December 2025 |
286.23 (1.11%) |
283.30 |
282.06 - 287.40 |
0.8755 times |
Mon 01 December 2025 |
283.10 (1.52%) |
278.01 |
276.14 - 283.42 |
1.5348 times |
Fri 28 November 2025 |
278.85 (0.5%) |
277.26 |
275.99 - 279.00 |
0.6637 times |
Wed 26 November 2025 |
277.47 (0.21%) |
277.76 |
276.63 - 279.53 |
0.5528 times |
Tue 25 November 2025 |
276.89 (0.4%) |
275.65 |
273.77 - 280.38 |
0.7542 times |
Mon 24 November 2025 |
275.80 (1.59%) |
272.50 |
270.45 - 277.00 |
0.9267 times |
Fri 21 November 2025 |
271.49 (1.97%) |
265.95 |
265.67 - 273.33 |
1.9375 times |
Thu 20 November 2025 |
266.25 (-0.86%) |
270.83 |
265.92 - 275.43 |
1.5104 times |
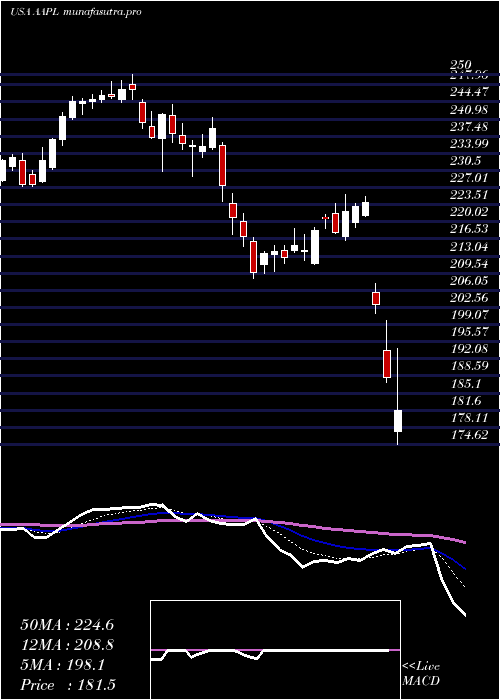
Weekly price and charts AppleInc Strong weekly Stock price targets for AppleInc AAPL are 277.47 and 289.95 | Weekly Target 1 | 268.71 | | Weekly Target 2 | 273.75 | | Weekly Target 3 | 281.18666666667 | | Weekly Target 4 | 286.23 | | Weekly Target 5 | 293.67 |
Weekly price and volumes for Apple Inc
| Date |
Closing |
Open |
Range |
Volume |
Fri 05 December 2025 |
278.80 (-0.02%) |
278.01 |
276.14 - 288.62 |
0.9253 times |
Fri 28 November 2025 |
278.85 (2.71%) |
272.50 |
270.45 - 280.38 |
0.519 times |
Fri 21 November 2025 |
271.49 (-0.34%) |
268.82 |
265.32 - 275.43 |
1.2525 times |
Fri 14 November 2025 |
272.41 (1.44%) |
268.96 |
267.46 - 277.12 |
1.0594 times |
Fri 07 November 2025 |
268.54 (-0.68%) |
268.33 |
266.77 - 273.40 |
0.7585 times |
Fri 31 October 2025 |
270.37 (0%) |
276.99 |
269.16 - 277.32 |
0.5088 times |
Fri 31 October 2025 |
270.37 (2.89%) |
264.88 |
264.65 - 277.32 |
1.733 times |
Fri 24 October 2025 |
262.77 (4.11%) |
253.57 |
251.66 - 265.29 |
1.0325 times |
Fri 17 October 2025 |
252.40 (2.91%) |
249.38 |
244.01 - 253.41 |
1.0218 times |
Fri 10 October 2025 |
245.27 (-4.9%) |
257.85 |
244.00 - 259.49 |
1.1893 times |
Fri 03 October 2025 |
257.90 (0.96%) |
254.56 |
253.01 - 259.24 |
1.1774 times |
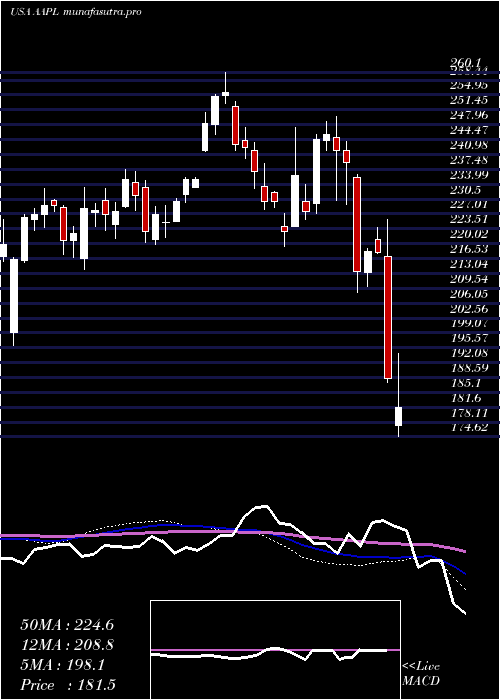
Monthly price and charts AppleInc Strong monthly Stock price targets for AppleInc AAPL are 277.47 and 289.95 | Monthly Target 1 | 268.71 | | Monthly Target 2 | 273.75 | | Monthly Target 3 | 281.18666666667 | | Monthly Target 4 | 286.23 | | Monthly Target 5 | 293.67 |
Monthly price and volumes Apple Inc
| Date |
Closing |
Open |
Range |
Volume |
Fri 05 December 2025 |
278.80 (-0.02%) |
278.01 |
276.14 - 288.62 |
0.1555 times |
Fri 28 November 2025 |
278.85 (3.14%) |
268.33 |
265.32 - 280.38 |
0.6034 times |
Fri 31 October 2025 |
270.37 (6.18%) |
255.04 |
244.00 - 277.32 |
1.0427 times |
Tue 30 September 2025 |
254.63 (9.69%) |
229.25 |
225.95 - 257.60 |
1.2555 times |
Fri 29 August 2025 |
232.14 (11.84%) |
210.87 |
201.50 - 235.12 |
1.1731 times |
Thu 31 July 2025 |
207.57 (1.17%) |
206.66 |
206.14 - 216.23 |
1.0589 times |
Mon 30 June 2025 |
205.17 (2.15%) |
200.28 |
195.07 - 207.39 |
1.0493 times |
Fri 30 May 2025 |
200.85 (-5.48%) |
209.08 |
193.25 - 214.56 |
1.1869 times |
Wed 30 April 2025 |
212.50 (-4.34%) |
219.80 |
169.21 - 225.19 |
1.488 times |
Mon 31 March 2025 |
222.13 (-8.15%) |
241.79 |
208.42 - 244.03 |
0.9867 times |
Fri 28 February 2025 |
241.84 (2.47%) |
229.99 |
225.70 - 250.00 |
0.8558 times |

DMA SMA EMA moving averages of Apple Inc AAPL
DMA (daily moving average) of Apple Inc AAPL
| DMA period | DMA value | | 5 day DMA | 282.59 | | 12 day DMA | 277.35 | | 20 day DMA | 274.77 | | 35 day DMA | 270.95 | | 50 day DMA | 265.59 | | 100 day DMA | 246.86 | | 150 day DMA | 232.58 | | 200 day DMA | 228.3 | EMA (exponential moving average) of Apple Inc AAPL
| EMA period | EMA current | EMA prev | EMA prev2 | | 5 day EMA | 280.66 | 281.59 | 282.06 | | 12 day EMA | 278.28 | 278.18 | 277.73 | | 20 day EMA | 275.55 | 275.21 | 274.64 | | 35 day EMA | 270.6 | 270.12 | 269.5 | | 50 day EMA | 266.22 | 265.71 | 265.1 |
SMA (simple moving average) of Apple Inc AAPL
| SMA period | SMA current | SMA prev | SMA prev2 | | 5 day SMA | 282.59 | 282.6 | 281.96 | | 12 day SMA | 277.35 | 276.41 | 275.31 | | 20 day SMA | 274.77 | 274.32 | 273.79 | | 35 day SMA | 270.95 | 270.03 | 269.14 | | 50 day SMA | 265.59 | 265.15 | 264.58 | | 100 day SMA | 246.86 | 246.17 | 245.46 | | 150 day SMA | 232.58 | 232.14 | 231.69 | | 200 day SMA | 228.3 | 228.13 | 227.95 |
|
|
