AppliedOptoelectronics AAOI full analysis,charts,indicators,moving averages,SMA,DMA,EMA,ADX,MACD,RSIApplied Optoelectronics AAOI WideScreen charts, DMA,SMA,EMA technical analysis, forecast prediction, by indicators ADX,MACD,RSI,CCI USA stock exchange
operates under Technology sector & deals in Semiconductors
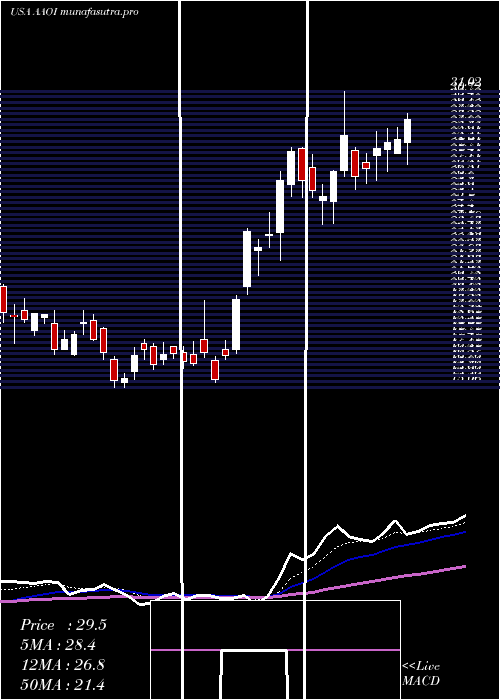
Daily price and charts and targets AppliedOptoelectronics Strong Daily Stock price targets for AppliedOptoelectronics AAOI are 25.54 and 27.01 | Daily Target 1 | 24.32 | | Daily Target 2 | 25.28 | | Daily Target 3 | 25.79 | | Daily Target 4 | 26.75 | | Daily Target 5 | 27.26 |
Daily price and volume Applied Optoelectronics
| Date |
Closing |
Open |
Range |
Volume |
Thu 04 December 2025 |
26.24 (2.3%) |
25.94 |
24.83 - 26.30 |
0.6714 times |
Wed 03 December 2025 |
25.65 (-1.42%) |
26.11 |
25.02 - 26.44 |
0.7453 times |
Tue 02 December 2025 |
26.02 (-1.92%) |
26.73 |
26.01 - 27.90 |
0.7049 times |
Mon 01 December 2025 |
26.53 (-0.93%) |
25.78 |
25.70 - 26.95 |
0.9772 times |
Fri 28 November 2025 |
26.78 (4.81%) |
25.61 |
25.56 - 27.29 |
0.9493 times |
Wed 26 November 2025 |
25.55 (12.36%) |
22.94 |
22.83 - 26.68 |
1.4668 times |
Tue 25 November 2025 |
22.74 (1.29%) |
22.38 |
21.40 - 22.85 |
0.4263 times |
Mon 24 November 2025 |
22.45 (9.09%) |
21.10 |
20.55 - 22.90 |
0.803 times |
Fri 21 November 2025 |
20.58 (5.59%) |
19.28 |
18.50 - 20.80 |
1.5748 times |
Thu 20 November 2025 |
19.49 (-6.61%) |
22.30 |
19.40 - 22.82 |
1.681 times |
Wed 19 November 2025 |
20.87 (-0.05%) |
20.84 |
20.54 - 21.44 |
0.9033 times |
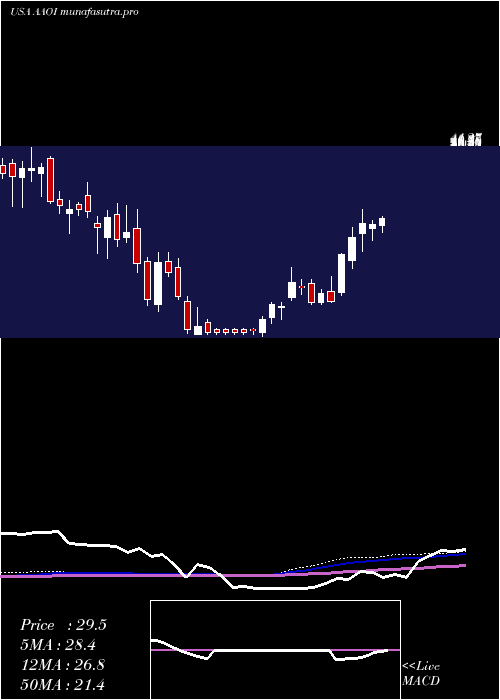
Weekly price and charts AppliedOptoelectronics Strong weekly Stock price targets for AppliedOptoelectronics AAOI are 25.54 and 28.61 | Weekly Target 1 | 23.25 | | Weekly Target 2 | 24.75 | | Weekly Target 3 | 26.323333333333 | | Weekly Target 4 | 27.82 | | Weekly Target 5 | 29.39 |
Weekly price and volumes for Applied Optoelectronics
| Date |
Closing |
Open |
Range |
Volume |
Thu 04 December 2025 |
26.24 (-2.02%) |
25.78 |
24.83 - 27.90 |
0.5586 times |
Fri 28 November 2025 |
26.78 (30.13%) |
21.10 |
20.55 - 27.29 |
0.6571 times |
Fri 21 November 2025 |
20.58 (-4.15%) |
21.42 |
18.50 - 23.00 |
1.0823 times |
Fri 14 November 2025 |
21.47 (-24.82%) |
28.01 |
19.20 - 28.05 |
1.4917 times |
Fri 07 November 2025 |
28.56 (-19.69%) |
31.00 |
23.74 - 32.20 |
1.1766 times |
Fri 31 October 2025 |
35.56 (0%) |
35.70 |
34.18 - 36.48 |
0.1889 times |
Fri 31 October 2025 |
35.56 (4.59%) |
35.00 |
34.10 - 38.99 |
1.2013 times |
Fri 24 October 2025 |
34.00 (5.26%) |
32.65 |
28.85 - 35.85 |
0.9606 times |
Fri 17 October 2025 |
32.30 (18.97%) |
28.50 |
26.66 - 33.69 |
1.0676 times |
Fri 10 October 2025 |
27.15 (-1.63%) |
28.00 |
27.12 - 35.20 |
1.6155 times |
Fri 03 October 2025 |
27.60 (7.1%) |
26.30 |
25.13 - 29.38 |
0.7875 times |
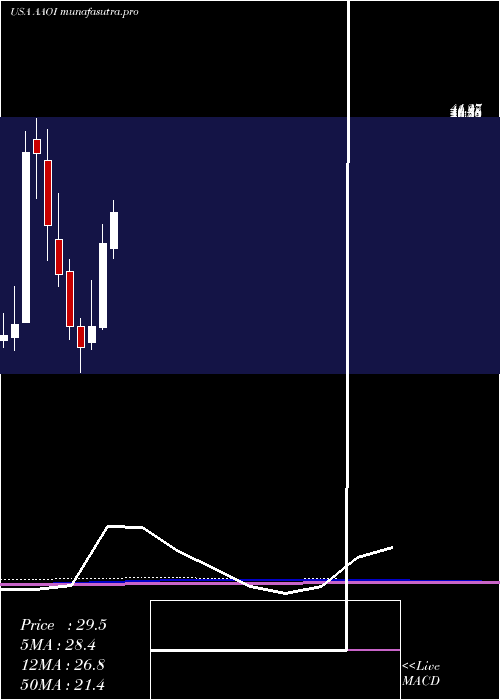
Monthly price and charts AppliedOptoelectronics Strong monthly Stock price targets for AppliedOptoelectronics AAOI are 25.54 and 28.61 | Monthly Target 1 | 23.25 | | Monthly Target 2 | 24.75 | | Monthly Target 3 | 26.323333333333 | | Monthly Target 4 | 27.82 | | Monthly Target 5 | 29.39 |
Monthly price and volumes Applied Optoelectronics
| Date |
Closing |
Open |
Range |
Volume |
Thu 04 December 2025 |
26.24 (-2.02%) |
25.78 |
24.83 - 27.90 |
0.1301 times |
Fri 28 November 2025 |
26.78 (-24.69%) |
31.00 |
18.50 - 32.20 |
1.0268 times |
Fri 31 October 2025 |
35.56 (37.14%) |
25.30 |
25.25 - 38.99 |
1.2822 times |
Tue 30 September 2025 |
25.93 (7.15%) |
22.83 |
22.04 - 31.13 |
1.1324 times |
Fri 29 August 2025 |
24.20 (5.82%) |
21.46 |
19.89 - 26.97 |
1.3093 times |
Thu 31 July 2025 |
22.87 (-10.98%) |
25.15 |
22.40 - 31.58 |
1.0978 times |
Mon 30 June 2025 |
25.69 (66.6%) |
15.31 |
15.06 - 28.01 |
1.2316 times |
Fri 30 May 2025 |
15.42 (20.56%) |
13.39 |
12.56 - 21.16 |
0.9146 times |
Wed 30 April 2025 |
12.79 (-16.68%) |
15.36 |
9.71 - 16.43 |
0.8171 times |
Mon 31 March 2025 |
15.35 (-29.78%) |
22.20 |
13.82 - 23.70 |
1.0583 times |
Fri 28 February 2025 |
21.86 (-21.7%) |
26.27 |
20.35 - 31.93 |
0.8992 times |
DMA SMA EMA moving averages of Applied Optoelectronics AAOI
DMA (daily moving average) of Applied Optoelectronics AAOI
| DMA period | DMA value | | 5 day DMA | 26.24 | | 12 day DMA | 23.65 | | 20 day DMA | 23.93 | | 35 day DMA | 28.05 | | 50 day DMA | 28.35 | | 100 day DMA | 26.74 | | 150 day DMA | 24.56 | | 200 day DMA | 22.41 | EMA (exponential moving average) of Applied Optoelectronics AAOI
| EMA period | EMA current | EMA prev | EMA prev2 | | 5 day EMA | 25.72 | 25.46 | 25.37 | | 12 day EMA | 25 | 24.78 | 24.62 | | 20 day EMA | 25.41 | 25.32 | 25.28 | | 35 day EMA | 26.24 | 26.24 | 26.28 | | 50 day EMA | 28.16 | 28.24 | 28.35 |
SMA (simple moving average) of Applied Optoelectronics AAOI
| SMA period | SMA current | SMA prev | SMA prev2 | | 5 day SMA | 26.24 | 26.11 | 25.52 | | 12 day SMA | 23.65 | 23.26 | 22.92 | | 20 day SMA | 23.93 | 24.19 | 24.38 | | 35 day SMA | 28.05 | 28.24 | 28.32 | | 50 day SMA | 28.35 | 28.35 | 28.4 | | 100 day SMA | 26.74 | 26.77 | 26.81 | | 150 day SMA | 24.56 | 24.47 | 24.38 | | 200 day SMA | 22.41 | 22.41 | 22.42 |
|
|
