YumBrands YUM full analysis,charts,indicators,moving averages,SMA,DMA,EMA,ADX,MACD,RSIYum Brands YUM WideScreen charts, DMA,SMA,EMA technical analysis, forecast prediction, by indicators ADX,MACD,RSI,CCI NYSE stock exchange
operates under Consumer Services sector & deals in Restaurants
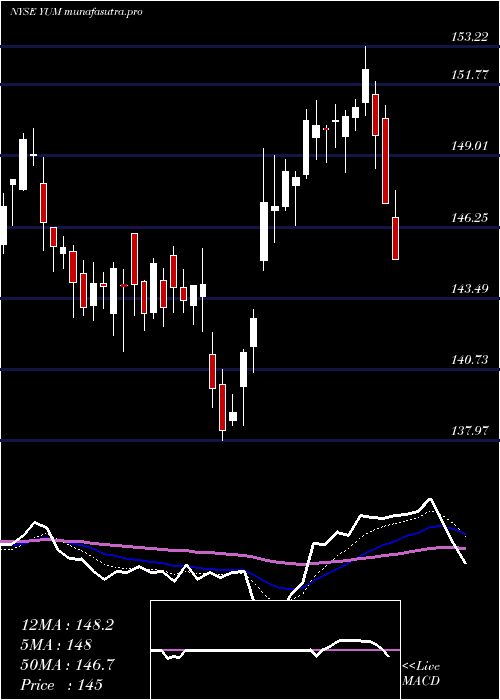
Daily price and charts and targets YumBrands Strong Daily Stock price targets for YumBrands YUM are 143.86 and 147.5 | Daily Target 1 | 143.19 | | Daily Target 2 | 144.53 | | Daily Target 3 | 146.83333333333 | | Daily Target 4 | 148.17 | | Daily Target 5 | 150.47 |
Daily price and volume Yum Brands
| Date |
Closing |
Open |
Range |
Volume |
Thu 04 December 2025 |
145.86 (-1.79%) |
147.61 |
145.50 - 149.14 |
1.043 times |
Wed 03 December 2025 |
148.52 (0.61%) |
147.68 |
147.60 - 149.64 |
1 times |
Tue 02 December 2025 |
147.62 (-2%) |
150.89 |
146.94 - 151.00 |
0.7883 times |
Mon 01 December 2025 |
150.64 (-1.68%) |
153.17 |
150.10 - 153.43 |
1.565 times |
Fri 28 November 2025 |
153.21 (-0.38%) |
153.06 |
153.06 - 154.51 |
0.4086 times |
Wed 26 November 2025 |
153.80 (-0.13%) |
154.00 |
153.80 - 155.23 |
0.8113 times |
Tue 25 November 2025 |
154.00 (1.93%) |
152.00 |
151.12 - 154.08 |
1.0664 times |
Mon 24 November 2025 |
151.08 (-1.24%) |
153.11 |
150.58 - 153.25 |
1.6184 times |
Fri 21 November 2025 |
152.98 (2.53%) |
149.87 |
149.87 - 153.39 |
1.0923 times |
Thu 20 November 2025 |
149.21 (0.6%) |
148.64 |
148.04 - 150.68 |
0.6067 times |
Wed 19 November 2025 |
148.32 (-0.34%) |
148.89 |
147.82 - 149.72 |
0.5171 times |
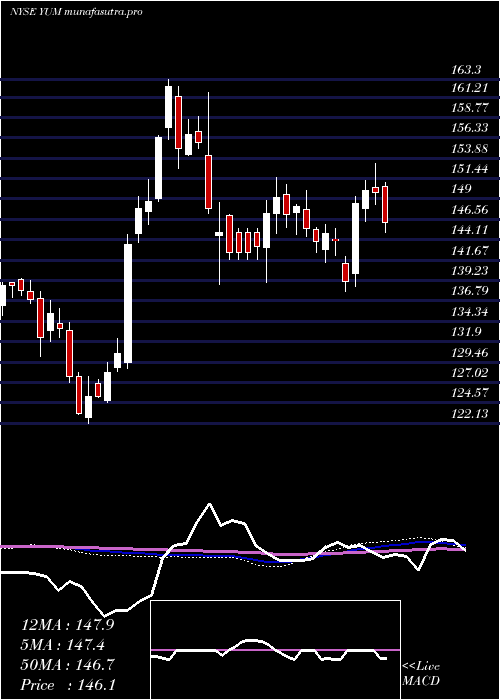
Weekly price and charts YumBrands Strong weekly Stock price targets for YumBrands YUM are 141.72 and 149.65 | Weekly Target 1 | 140.33 | | Weekly Target 2 | 143.1 | | Weekly Target 3 | 148.26333333333 | | Weekly Target 4 | 151.03 | | Weekly Target 5 | 156.19 |
Weekly price and volumes for Yum Brands
| Date |
Closing |
Open |
Range |
Volume |
Thu 04 December 2025 |
145.86 (-4.8%) |
153.17 |
145.50 - 153.43 |
1.1432 times |
Fri 28 November 2025 |
153.21 (0.15%) |
153.11 |
150.58 - 155.23 |
1.0154 times |
Fri 21 November 2025 |
152.98 (2.66%) |
149.00 |
147.82 - 153.39 |
1.0989 times |
Fri 14 November 2025 |
149.02 (-0.07%) |
148.16 |
147.32 - 151.10 |
1.1212 times |
Fri 07 November 2025 |
149.12 (7.89%) |
146.23 |
143.14 - 154.27 |
1.6116 times |
Fri 31 October 2025 |
138.21 (0%) |
138.42 |
137.33 - 138.46 |
0.2788 times |
Fri 31 October 2025 |
138.21 (-3.59%) |
143.61 |
137.33 - 144.38 |
1.0707 times |
Fri 24 October 2025 |
143.36 (-1.3%) |
145.53 |
143.14 - 149.53 |
0.8276 times |
Fri 17 October 2025 |
145.25 (2.56%) |
141.07 |
139.29 - 146.24 |
1.0078 times |
Fri 10 October 2025 |
141.62 (-6.02%) |
150.09 |
141.29 - 150.67 |
0.8247 times |
Fri 03 October 2025 |
150.69 (-1.32%) |
153.51 |
149.83 - 155.05 |
0.9348 times |
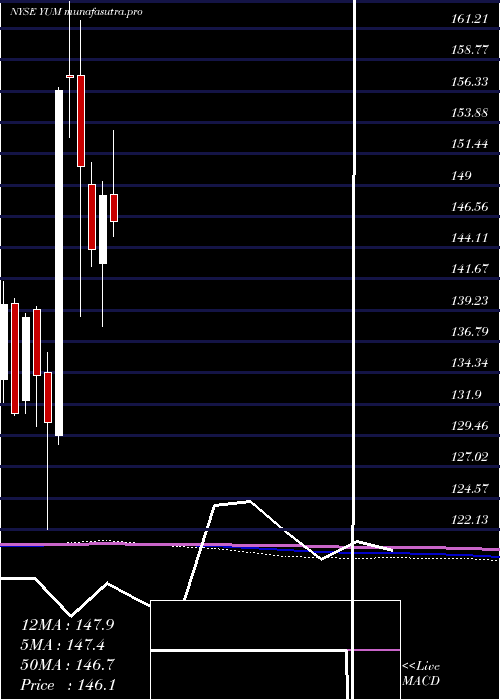
Monthly price and charts YumBrands Strong monthly Stock price targets for YumBrands YUM are 141.72 and 149.65 | Monthly Target 1 | 140.33 | | Monthly Target 2 | 143.1 | | Monthly Target 3 | 148.26333333333 | | Monthly Target 4 | 151.03 | | Monthly Target 5 | 156.19 |
Monthly price and volumes Yum Brands
| Date |
Closing |
Open |
Range |
Volume |
Thu 04 December 2025 |
145.86 (-4.8%) |
153.17 |
145.50 - 153.43 |
0.257 times |
Fri 28 November 2025 |
153.21 (10.85%) |
146.23 |
143.14 - 155.23 |
1.0897 times |
Fri 31 October 2025 |
138.21 (-9.07%) |
152.59 |
137.33 - 153.75 |
1.0174 times |
Tue 30 September 2025 |
152.00 (3.42%) |
145.27 |
142.35 - 155.05 |
1.0551 times |
Fri 29 August 2025 |
146.97 (1.96%) |
145.67 |
139.06 - 153.07 |
1.1365 times |
Thu 31 July 2025 |
144.15 (-2.72%) |
148.28 |
143.49 - 153.22 |
0.9714 times |
Mon 30 June 2025 |
148.18 (2.95%) |
142.90 |
137.97 - 149.29 |
1.0022 times |
Fri 30 May 2025 |
143.94 (-4.32%) |
149.07 |
142.62 - 150.77 |
1.0223 times |
Wed 30 April 2025 |
150.44 (-4.4%) |
157.54 |
138.72 - 161.81 |
1.4011 times |
Mon 31 March 2025 |
157.36 (0.63%) |
157.52 |
152.66 - 163.30 |
1.0471 times |
Fri 28 February 2025 |
156.37 (19.82%) |
129.44 |
128.73 - 156.56 |
1.2134 times |
DMA SMA EMA moving averages of Yum Brands YUM
DMA (daily moving average) of Yum Brands YUM
| DMA period | DMA value | | 5 day DMA | 149.17 | | 12 day DMA | 150.34 | | 20 day DMA | 149.8 | | 35 day DMA | 147.32 | | 50 day DMA | 147.5 | | 100 day DMA | 146.93 | | 150 day DMA | 146.68 | | 200 day DMA | 147.92 | EMA (exponential moving average) of Yum Brands YUM
| EMA period | EMA current | EMA prev | EMA prev2 | | 5 day EMA | 148.53 | 149.86 | 150.53 | | 12 day EMA | 149.46 | 150.11 | 150.4 | | 20 day EMA | 149.14 | 149.49 | 149.59 | | 35 day EMA | 148.71 | 148.88 | 148.9 | | 50 day EMA | 147.68 | 147.75 | 147.72 |
SMA (simple moving average) of Yum Brands YUM
| SMA period | SMA current | SMA prev | SMA prev2 | | 5 day SMA | 149.17 | 150.76 | 151.85 | | 12 day SMA | 150.34 | 150.52 | 150.56 | | 20 day SMA | 149.8 | 149.97 | 150.03 | | 35 day SMA | 147.32 | 147.28 | 147.15 | | 50 day SMA | 147.5 | 147.57 | 147.59 | | 100 day SMA | 146.93 | 146.92 | 146.9 | | 150 day SMA | 146.68 | 146.71 | 146.7 | | 200 day SMA | 147.92 | 147.92 | 147.92 |
|
|
