XaiOctagon XFLT full analysis,charts,indicators,moving averages,SMA,DMA,EMA,ADX,MACD,RSIXai Octagon XFLT WideScreen charts, DMA,SMA,EMA technical analysis, forecast prediction, by indicators ADX,MACD,RSI,CCI NYSE stock exchange
operates under N A sector & deals in N A
Daily price and charts and targets XaiOctagon Strong Daily Stock price targets for XaiOctagon XFLT are 4.57 and 4.6 | Daily Target 1 | 4.56 | | Daily Target 2 | 4.57 | | Daily Target 3 | 4.59 | | Daily Target 4 | 4.6 | | Daily Target 5 | 4.62 |
Daily price and volume Xai Octagon
| Date |
Closing |
Open |
Range |
Volume |
Fri 05 December 2025 |
4.58 (-0.65%) |
4.58 |
4.58 - 4.61 |
1.0215 times |
Thu 04 December 2025 |
4.61 (-0.43%) |
4.61 |
4.57 - 4.63 |
0.6861 times |
Wed 03 December 2025 |
4.63 (0.22%) |
4.60 |
4.59 - 4.65 |
0.6386 times |
Tue 02 December 2025 |
4.62 (0.43%) |
4.60 |
4.56 - 4.63 |
1.1261 times |
Mon 01 December 2025 |
4.60 (-1.5%) |
4.64 |
4.58 - 4.65 |
0.9557 times |
Fri 28 November 2025 |
4.67 (1.3%) |
4.59 |
4.59 - 4.67 |
0.4941 times |
Wed 26 November 2025 |
4.61 (0.22%) |
4.59 |
4.58 - 4.64 |
0.6927 times |
Tue 25 November 2025 |
4.60 (1.55%) |
4.56 |
4.50 - 4.60 |
1.5376 times |
Mon 24 November 2025 |
4.53 (1.34%) |
4.47 |
4.45 - 4.55 |
1.7755 times |
Fri 21 November 2025 |
4.47 (0.68%) |
4.45 |
4.41 - 4.49 |
1.072 times |
Thu 20 November 2025 |
4.44 (-0.67%) |
4.49 |
4.43 - 4.52 |
1.2996 times |
Weekly price and charts XaiOctagon Strong weekly Stock price targets for XaiOctagon XFLT are 4.53 and 4.62 | Weekly Target 1 | 4.51 | | Weekly Target 2 | 4.54 | | Weekly Target 3 | 4.5966666666667 | | Weekly Target 4 | 4.63 | | Weekly Target 5 | 4.69 |
Weekly price and volumes for Xai Octagon
| Date |
Closing |
Open |
Range |
Volume |
Fri 05 December 2025 |
4.58 (-1.93%) |
4.64 |
4.56 - 4.65 |
1.2479 times |
Fri 28 November 2025 |
4.67 (4.47%) |
4.47 |
4.45 - 4.67 |
1.2681 times |
Fri 21 November 2025 |
4.47 (-6.29%) |
4.69 |
4.41 - 4.69 |
1.7043 times |
Fri 14 November 2025 |
4.77 (-3.05%) |
4.91 |
4.77 - 4.93 |
0.9285 times |
Fri 07 November 2025 |
4.92 (-0.61%) |
4.93 |
4.91 - 4.98 |
0.7763 times |
Fri 31 October 2025 |
4.95 (0%) |
4.95 |
4.92 - 4.97 |
0.1559 times |
Fri 31 October 2025 |
4.95 (-1.39%) |
4.99 |
4.90 - 5.02 |
0.6727 times |
Fri 24 October 2025 |
5.02 (2.45%) |
4.90 |
4.73 - 5.02 |
1.2236 times |
Fri 17 October 2025 |
4.90 (-5.59%) |
5.20 |
4.82 - 5.20 |
1.2106 times |
Fri 10 October 2025 |
5.19 (-1.52%) |
5.30 |
5.18 - 5.30 |
0.8122 times |
Fri 03 October 2025 |
5.27 (-0.75%) |
5.30 |
5.24 - 5.31 |
0.9352 times |

Monthly price and charts XaiOctagon Strong monthly Stock price targets for XaiOctagon XFLT are 4.53 and 4.62 | Monthly Target 1 | 4.51 | | Monthly Target 2 | 4.54 | | Monthly Target 3 | 4.5966666666667 | | Monthly Target 4 | 4.63 | | Monthly Target 5 | 4.69 |
Monthly price and volumes Xai Octagon
| Date |
Closing |
Open |
Range |
Volume |
Fri 05 December 2025 |
4.58 (-1.93%) |
4.64 |
4.56 - 4.65 |
0.3727 times |
Fri 28 November 2025 |
4.67 (-5.66%) |
4.93 |
4.41 - 4.98 |
1.3971 times |
Fri 31 October 2025 |
4.95 (-6.6%) |
5.30 |
4.73 - 5.31 |
1.3765 times |
Tue 30 September 2025 |
5.30 (-4.68%) |
5.56 |
5.24 - 5.70 |
1.1083 times |
Fri 29 August 2025 |
5.56 (-0.36%) |
5.59 |
5.40 - 5.61 |
1.0973 times |
Thu 31 July 2025 |
5.58 (-1.24%) |
5.65 |
5.42 - 5.72 |
1.0542 times |
Mon 30 June 2025 |
5.65 (-2.42%) |
5.81 |
5.45 - 5.86 |
0.7914 times |
Fri 30 May 2025 |
5.79 (2.66%) |
5.72 |
5.57 - 5.80 |
0.7476 times |
Wed 30 April 2025 |
5.64 (-4.57%) |
5.96 |
4.76 - 5.96 |
1.0526 times |
Mon 31 March 2025 |
5.91 (-7.66%) |
6.45 |
5.89 - 6.45 |
1.0024 times |
Fri 28 February 2025 |
6.40 (-2.29%) |
6.49 |
6.34 - 6.64 |
1.0409 times |

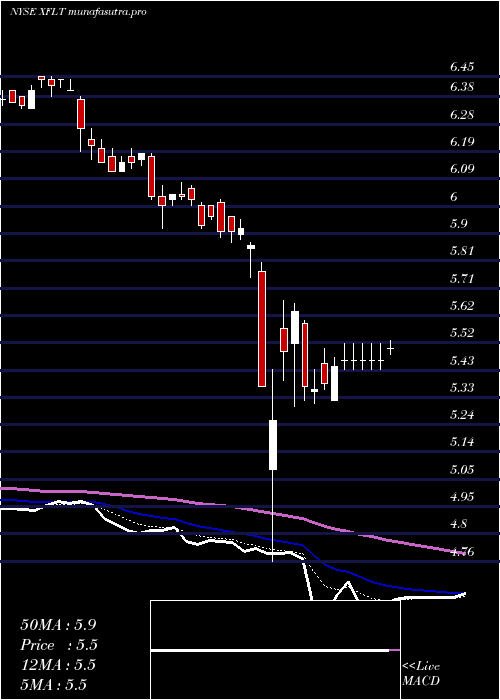
DMA SMA EMA moving averages of Xai Octagon XFLT
DMA (daily moving average) of Xai Octagon XFLT
| DMA period | DMA value | | 5 day DMA | 4.61 | | 12 day DMA | 4.57 | | 20 day DMA | 4.66 | | 35 day DMA | 4.78 | | 50 day DMA | 4.9 | | 100 day DMA | 5.21 | | 150 day DMA | 5.36 | | 200 day DMA | 5.49 | EMA (exponential moving average) of Xai Octagon XFLT
| EMA period | EMA current | EMA prev | EMA prev2 | | 5 day EMA | 4.61 | 4.62 | 4.62 | | 12 day EMA | 4.62 | 4.63 | 4.63 | | 20 day EMA | 4.67 | 4.68 | 4.69 | | 35 day EMA | 4.79 | 4.8 | 4.81 | | 50 day EMA | 4.93 | 4.94 | 4.95 |
SMA (simple moving average) of Xai Octagon XFLT
| SMA period | SMA current | SMA prev | SMA prev2 | | 5 day SMA | 4.61 | 4.63 | 4.63 | | 12 day SMA | 4.57 | 4.57 | 4.57 | | 20 day SMA | 4.66 | 4.68 | 4.69 | | 35 day SMA | 4.78 | 4.79 | 4.8 | | 50 day SMA | 4.9 | 4.92 | 4.93 | | 100 day SMA | 5.21 | 5.22 | 5.23 | | 150 day SMA | 5.36 | 5.37 | 5.38 | | 200 day SMA | 5.49 | 5.5 | 5.51 |
|
|
