WhiteMountains WTM full analysis,charts,indicators,moving averages,SMA,DMA,EMA,ADX,MACD,RSIWhite Mountains WTM WideScreen charts, DMA,SMA,EMA technical analysis, forecast prediction, by indicators ADX,MACD,RSI,CCI NYSE stock exchange
operates under Finance sector & deals in Property Casualty Insurers
Daily price and charts and targets WhiteMountains Strong Daily Stock price targets for WhiteMountains WTM are 1871.67 and 1958.92 | Daily Target 1 | 1799.65 | | Daily Target 2 | 1856.43 | | Daily Target 3 | 1886.9033333333 | | Daily Target 4 | 1943.68 | | Daily Target 5 | 1974.15 |
Daily price and volume White Mountains
| Date |
Closing |
Open |
Range |
Volume |
Fri 17 October 2025 |
1913.20 (3.55%) |
1830.13 |
1830.13 - 1917.38 |
1.0696 times |
Thu 16 October 2025 |
1847.67 (-2.34%) |
1887.11 |
1836.71 - 1893.06 |
1.1808 times |
Wed 15 October 2025 |
1892.01 (-2.12%) |
1931.79 |
1890.29 - 1939.50 |
1.1841 times |
Tue 14 October 2025 |
1933.01 (1.56%) |
1913.50 |
1907.02 - 1936.54 |
0.7621 times |
Mon 13 October 2025 |
1903.24 (0.28%) |
1893.30 |
1893.30 - 1925.51 |
1.2495 times |
Fri 10 October 2025 |
1898.00 (-1.18%) |
1932.67 |
1891.26 - 1936.00 |
0.6934 times |
Thu 09 October 2025 |
1920.68 (1.29%) |
1901.00 |
1899.76 - 1926.74 |
0.7556 times |
Wed 08 October 2025 |
1896.20 (-0.47%) |
1900.00 |
1892.00 - 1905.00 |
1.2495 times |
Tue 07 October 2025 |
1905.23 (2.19%) |
1864.00 |
1815.44 - 1908.65 |
1.2985 times |
Mon 06 October 2025 |
1864.48 (1.26%) |
1875.00 |
1827.00 - 1875.00 |
0.557 times |
Fri 03 October 2025 |
1841.34 (10.62%) |
1784.78 |
1784.78 - 1866.22 |
2.9013 times |
Weekly price and charts WhiteMountains Strong weekly Stock price targets for WhiteMountains WTM are 1871.67 and 1981.04 | Weekly Target 1 | 1784.91 | | Weekly Target 2 | 1849.05 | | Weekly Target 3 | 1894.2766666667 | | Weekly Target 4 | 1958.42 | | Weekly Target 5 | 2003.65 |
Weekly price and volumes for White Mountains
| Date |
Closing |
Open |
Range |
Volume |
Fri 17 October 2025 |
1913.20 (0.8%) |
1893.30 |
1830.13 - 1939.50 |
1.1409 times |
Fri 10 October 2025 |
1898.00 (3.08%) |
1875.00 |
1815.44 - 1936.00 |
0.954 times |
Fri 03 October 2025 |
1841.34 (7.31%) |
1718.30 |
1648.00 - 1866.22 |
1.4395 times |
Fri 26 September 2025 |
1715.94 (-3.05%) |
1760.00 |
1687.47 - 1783.50 |
1.1272 times |
Fri 19 September 2025 |
1769.87 (0.4%) |
1760.00 |
1700.00 - 1776.22 |
1.2183 times |
Fri 12 September 2025 |
1762.81 (-1.85%) |
1785.00 |
1748.41 - 1800.06 |
1.4444 times |
Fri 05 September 2025 |
1796.03 (-1.87%) |
1815.00 |
1763.92 - 1842.08 |
0.7167 times |
Fri 29 August 2025 |
1830.18 (0%) |
1837.00 |
1830.18 - 1839.31 |
0.1405 times |
Fri 29 August 2025 |
1830.18 (-1.77%) |
1830.00 |
1809.90 - 1850.82 |
0.9175 times |
Fri 22 August 2025 |
1863.22 (5.29%) |
1775.00 |
1758.68 - 1868.36 |
0.901 times |
Fri 15 August 2025 |
1769.60 (1.03%) |
1746.00 |
1744.00 - 1880.11 |
1.1018 times |

Monthly price and charts WhiteMountains Strong monthly Stock price targets for WhiteMountains WTM are 1780.6 and 2072.1 | Monthly Target 1 | 1542.07 | | Monthly Target 2 | 1727.63 | | Monthly Target 3 | 1833.5666666667 | | Monthly Target 4 | 2019.13 | | Monthly Target 5 | 2125.07 |
Monthly price and volumes White Mountains
| Date |
Closing |
Open |
Range |
Volume |
Fri 17 October 2025 |
1913.20 (14.46%) |
1670.00 |
1648.00 - 1939.50 |
0.9991 times |
Tue 30 September 2025 |
1671.52 (-8.67%) |
1815.00 |
1659.17 - 1842.08 |
1.7161 times |
Fri 29 August 2025 |
1830.18 (2.37%) |
1779.93 |
1744.00 - 1880.11 |
1.3651 times |
Thu 31 July 2025 |
1787.80 (-0.44%) |
1794.37 |
1750.00 - 1831.19 |
1.2559 times |
Mon 30 June 2025 |
1795.72 (0.61%) |
1768.00 |
1741.28 - 1826.38 |
1.0136 times |
Fri 30 May 2025 |
1784.80 (0.98%) |
1760.00 |
1746.93 - 1845.00 |
0.7531 times |
Wed 30 April 2025 |
1767.45 (-8.22%) |
1931.68 |
1678.87 - 1937.23 |
0.8516 times |
Mon 31 March 2025 |
1925.81 (4.13%) |
1883.91 |
1803.96 - 1931.35 |
0.7143 times |
Fri 28 February 2025 |
1849.50 (-4.29%) |
1891.35 |
1818.14 - 1993.86 |
0.549 times |
Fri 31 January 2025 |
1932.46 (-0.65%) |
1951.30 |
1809.51 - 1975.00 |
0.7821 times |
Tue 31 December 2024 |
1945.06 (-2.97%) |
1979.41 |
1884.66 - 1997.79 |
0.4873 times |

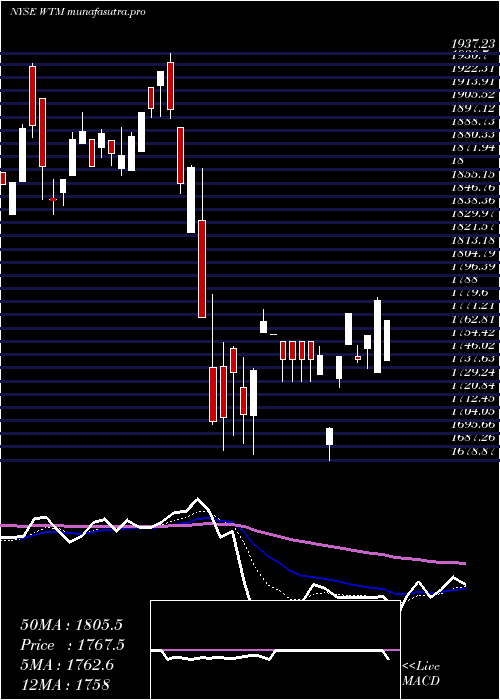
DMA SMA EMA moving averages of White Mountains WTM
DMA (daily moving average) of White Mountains WTM
| DMA period | DMA value | | 5 day DMA | 1897.83 | | 12 day DMA | 1873.3 | | 20 day DMA | 1808.65 | | 35 day DMA | 1792.74 | | 50 day DMA | 1802.41 | | 100 day DMA | 1793.6 | | 150 day DMA | 1795.01 | | 200 day DMA | 1815.99 | EMA (exponential moving average) of White Mountains WTM
| EMA period | EMA current | EMA prev | EMA prev2 | | 5 day EMA | 1892.34 | 1881.91 | 1899.03 | | 12 day EMA | 1864.94 | 1856.17 | 1857.72 | | 20 day EMA | 1838.73 | 1830.9 | 1829.14 | | 35 day EMA | 1820.51 | 1815.05 | 1813.13 | | 50 day EMA | 1809.06 | 1804.81 | 1803.06 |
SMA (simple moving average) of White Mountains WTM
| SMA period | SMA current | SMA prev | SMA prev2 | | 5 day SMA | 1897.83 | 1894.79 | 1909.39 | | 12 day SMA | 1873.3 | 1851.41 | 1836.73 | | 20 day SMA | 1808.65 | 1801.48 | 1796.78 | | 35 day SMA | 1792.74 | 1790.36 | 1789.73 | | 50 day SMA | 1802.41 | 1799.18 | 1797.23 | | 100 day SMA | 1793.6 | 1792.3 | 1791.8 | | 150 day SMA | 1795.01 | 1794.64 | 1794.62 | | 200 day SMA | 1815.99 | 1816.15 | 1816.55 |
|
|
