WhitestoneReit WSR full analysis,charts,indicators,moving averages,SMA,DMA,EMA,ADX,MACD,RSIWhitestone Reit WSR WideScreen charts, DMA,SMA,EMA technical analysis, forecast prediction, by indicators ADX,MACD,RSI,CCI NYSE stock exchange
operates under Consumer Services sector & deals in Real Estate Investment Trusts
Daily price and charts and targets WhitestoneReit Strong Daily Stock price targets for WhitestoneReit WSR are 11.84 and 12.1 | Daily Target 1 | 11.76 | | Daily Target 2 | 11.92 | | Daily Target 3 | 12.02 | | Daily Target 4 | 12.18 | | Daily Target 5 | 12.28 |
Daily price and volume Whitestone Reit
| Date |
Closing |
Open |
Range |
Volume |
Mon 20 October 2025 |
12.08 (1.51%) |
12.12 |
11.86 - 12.12 |
0.4853 times |
Fri 17 October 2025 |
11.90 (0.59%) |
11.83 |
11.79 - 11.92 |
0.9335 times |
Thu 16 October 2025 |
11.83 (-1.25%) |
11.98 |
11.80 - 11.98 |
0.8399 times |
Wed 15 October 2025 |
11.98 (0.93%) |
11.89 |
11.89 - 12.08 |
0.887 times |
Tue 14 October 2025 |
11.87 (1.02%) |
11.67 |
11.63 - 11.90 |
1.0246 times |
Mon 13 October 2025 |
11.75 (2.53%) |
11.49 |
11.45 - 11.78 |
1.5534 times |
Fri 10 October 2025 |
11.46 (-1.38%) |
11.68 |
11.43 - 11.72 |
1.1293 times |
Thu 09 October 2025 |
11.62 (-0.85%) |
11.72 |
11.58 - 11.80 |
0.8111 times |
Wed 08 October 2025 |
11.72 (0.34%) |
11.68 |
11.58 - 11.74 |
0.9252 times |
Tue 07 October 2025 |
11.68 (-1.6%) |
11.82 |
11.66 - 11.83 |
1.4105 times |
Mon 06 October 2025 |
11.87 (-1.66%) |
12.06 |
11.84 - 12.06 |
1.4686 times |
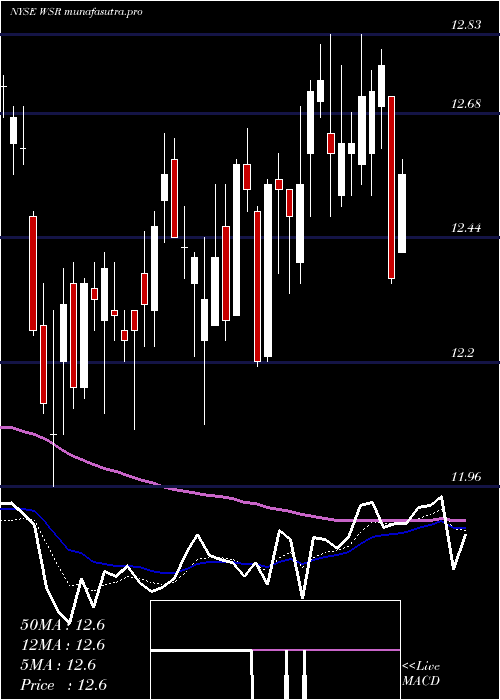
Weekly price and charts WhitestoneReit Strong weekly Stock price targets for WhitestoneReit WSR are 11.84 and 12.1 | Weekly Target 1 | 11.76 | | Weekly Target 2 | 11.92 | | Weekly Target 3 | 12.02 | | Weekly Target 4 | 12.18 | | Weekly Target 5 | 12.28 |
Weekly price and volumes for Whitestone Reit
| Date |
Closing |
Open |
Range |
Volume |
Mon 20 October 2025 |
12.08 (1.51%) |
12.12 |
11.86 - 12.12 |
0.1002 times |
Fri 17 October 2025 |
11.90 (3.84%) |
11.49 |
11.45 - 12.08 |
1.0813 times |
Fri 10 October 2025 |
11.46 (-5.05%) |
12.06 |
11.43 - 12.06 |
1.1858 times |
Fri 03 October 2025 |
12.07 (-3.44%) |
12.49 |
11.94 - 12.50 |
1.2924 times |
Fri 26 September 2025 |
12.50 (-1.81%) |
12.80 |
12.43 - 12.88 |
0.9699 times |
Fri 19 September 2025 |
12.73 (-2.23%) |
13.05 |
12.65 - 13.07 |
1.9685 times |
Fri 12 September 2025 |
13.02 (-1.21%) |
12.98 |
12.75 - 13.15 |
0.9628 times |
Fri 05 September 2025 |
13.18 (0.15%) |
13.02 |
12.82 - 13.24 |
1.0048 times |
Fri 29 August 2025 |
13.16 (0%) |
13.00 |
12.97 - 13.19 |
0.3011 times |
Fri 29 August 2025 |
13.16 (1.78%) |
12.93 |
12.77 - 13.19 |
1.1331 times |
Fri 22 August 2025 |
12.93 (6.24%) |
12.14 |
12.14 - 13.01 |
1.2148 times |
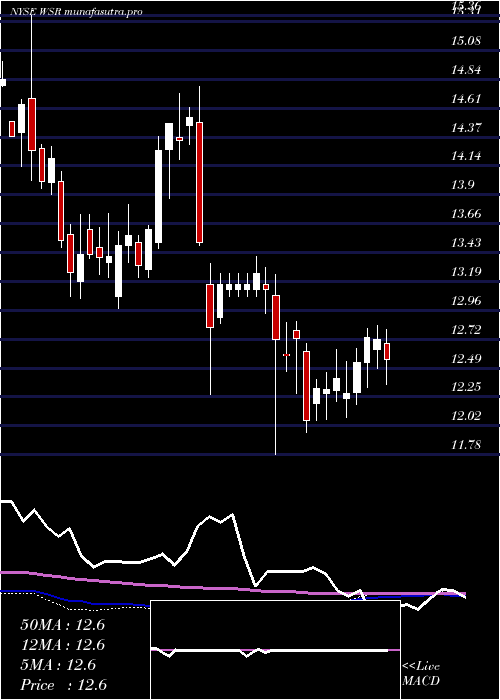
Monthly price and charts WhitestoneReit Strong monthly Stock price targets for WhitestoneReit WSR are 11.36 and 12.16 | Monthly Target 1 | 11.11 | | Monthly Target 2 | 11.6 | | Monthly Target 3 | 11.913333333333 | | Monthly Target 4 | 12.4 | | Monthly Target 5 | 12.71 |
Monthly price and volumes Whitestone Reit
| Date |
Closing |
Open |
Range |
Volume |
Mon 20 October 2025 |
12.08 (-1.63%) |
12.13 |
11.43 - 12.23 |
0.5554 times |
Tue 30 September 2025 |
12.28 (-6.69%) |
13.02 |
12.19 - 13.24 |
0.9933 times |
Fri 29 August 2025 |
13.16 (7.96%) |
12.13 |
11.80 - 13.19 |
0.8836 times |
Thu 31 July 2025 |
12.19 (-2.32%) |
12.39 |
12.11 - 12.83 |
1.1109 times |
Mon 30 June 2025 |
12.48 (1.3%) |
12.28 |
12.07 - 12.65 |
1.1117 times |
Fri 30 May 2025 |
12.32 (-5.52%) |
12.56 |
11.78 - 12.87 |
1.2917 times |
Wed 30 April 2025 |
13.04 (-10.5%) |
14.56 |
12.27 - 14.72 |
1.1039 times |
Mon 31 March 2025 |
14.57 (6.98%) |
13.51 |
13.46 - 14.78 |
1.2999 times |
Fri 28 February 2025 |
13.62 (1.64%) |
13.07 |
12.97 - 13.82 |
0.7505 times |
Fri 31 January 2025 |
13.40 (-5.43%) |
14.18 |
13.05 - 14.25 |
0.8991 times |
Tue 31 December 2024 |
14.17 (-4.51%) |
14.50 |
13.92 - 15.36 |
0.9097 times |
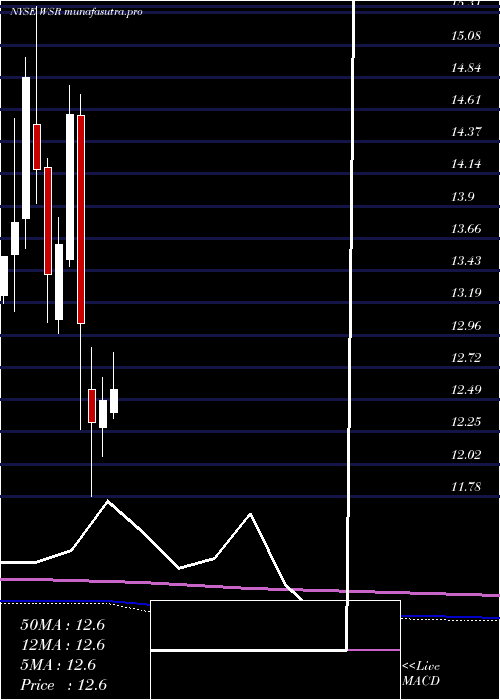
DMA SMA EMA moving averages of Whitestone Reit WSR
DMA (daily moving average) of Whitestone Reit WSR
| DMA period | DMA value | | 5 day DMA | 11.93 | | 12 day DMA | 11.82 | | 20 day DMA | 12.07 | | 35 day DMA | 12.43 | | 50 day DMA | 12.49 | | 100 day DMA | 12.45 | | 150 day DMA | 12.7 | | 200 day DMA | 12.93 | EMA (exponential moving average) of Whitestone Reit WSR
| EMA period | EMA current | EMA prev | EMA prev2 | | 5 day EMA | 11.93 | 11.85 | 11.83 | | 12 day EMA | 11.94 | 11.92 | 11.92 | | 20 day EMA | 12.05 | 12.05 | 12.07 | | 35 day EMA | 12.21 | 12.22 | 12.24 | | 50 day EMA | 12.41 | 12.42 | 12.44 |
SMA (simple moving average) of Whitestone Reit WSR
| SMA period | SMA current | SMA prev | SMA prev2 | | 5 day SMA | 11.93 | 11.87 | 11.78 | | 12 day SMA | 11.82 | 11.82 | 11.84 | | 20 day SMA | 12.07 | 12.1 | 12.15 | | 35 day SMA | 12.43 | 12.46 | 12.5 | | 50 day SMA | 12.49 | 12.49 | 12.49 | | 100 day SMA | 12.45 | 12.46 | 12.46 | | 150 day SMA | 12.7 | 12.72 | 12.73 | | 200 day SMA | 12.93 | 12.94 | 12.95 |
|
|
