WR WRB full analysis,charts,indicators,moving averages,SMA,DMA,EMA,ADX,MACD,RSIW R WRB WideScreen charts, DMA,SMA,EMA technical analysis, forecast prediction, by indicators ADX,MACD,RSI,CCI NYSE stock exchange
operates under Finance sector & deals in Property Casualty Insurers
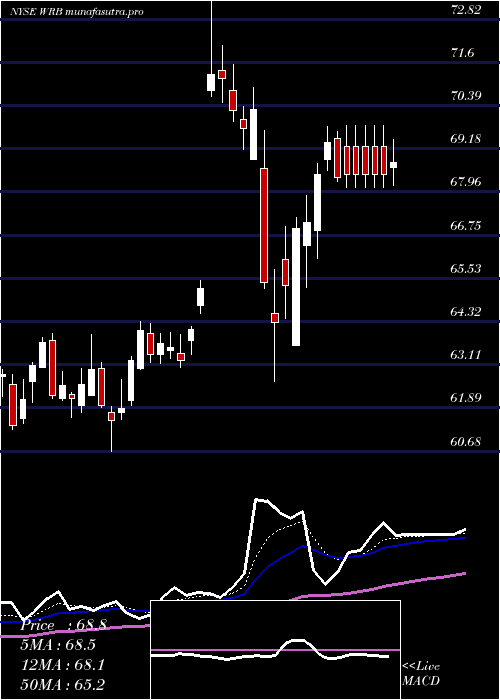
Daily price and charts and targets WR Strong Daily Stock price targets for WR WRB are 63.66 and 68.45 | Daily Target 1 | 62.64 | | Daily Target 2 | 64.68 | | Daily Target 3 | 67.43 | | Daily Target 4 | 69.47 | | Daily Target 5 | 72.22 |
Daily price and volume W R
| Date |
Closing |
Open |
Range |
Volume |
Fri 05 December 2025 |
66.72 (-5.86%) |
68.04 |
65.39 - 70.18 |
3.7769 times |
Thu 04 December 2025 |
70.87 (-1.09%) |
71.69 |
70.57 - 71.94 |
1.3705 times |
Wed 03 December 2025 |
71.65 (-1.58%) |
73.13 |
71.32 - 73.54 |
0.8343 times |
Tue 02 December 2025 |
72.80 (-0.25%) |
72.54 |
72.50 - 73.70 |
0.9752 times |
Mon 01 December 2025 |
72.98 (-6.06%) |
77.60 |
72.96 - 78.06 |
1.0466 times |
Fri 28 November 2025 |
77.69 (0.06%) |
77.49 |
77.43 - 77.96 |
0.1519 times |
Wed 26 November 2025 |
77.64 (-0.36%) |
78.15 |
77.64 - 78.40 |
0.2873 times |
Tue 25 November 2025 |
77.92 (0.5%) |
78.07 |
77.77 - 78.43 |
0.4209 times |
Mon 24 November 2025 |
77.53 (-0.73%) |
78.16 |
77.37 - 78.33 |
0.652 times |
Fri 21 November 2025 |
78.10 (1.03%) |
77.59 |
77.42 - 78.96 |
0.4843 times |
Thu 20 November 2025 |
77.30 (0.8%) |
77.06 |
76.65 - 77.63 |
0.4455 times |
Weekly price and charts WR Strong weekly Stock price targets for WR WRB are 59.72 and 72.39 | Weekly Target 1 | 57.39 | | Weekly Target 2 | 62.05 | | Weekly Target 3 | 70.056666666667 | | Weekly Target 4 | 74.72 | | Weekly Target 5 | 82.73 |
Weekly price and volumes for W R
| Date |
Closing |
Open |
Range |
Volume |
Fri 05 December 2025 |
66.72 (-14.12%) |
77.60 |
65.39 - 78.06 |
2.4032 times |
Fri 28 November 2025 |
77.69 (-0.52%) |
78.16 |
77.37 - 78.43 |
0.454 times |
Fri 21 November 2025 |
78.10 (1.43%) |
77.34 |
76.29 - 78.96 |
0.7318 times |
Fri 14 November 2025 |
77.00 (2.71%) |
74.59 |
74.32 - 77.90 |
0.8319 times |
Fri 07 November 2025 |
74.97 (5.09%) |
72.12 |
72.11 - 75.70 |
0.7256 times |
Fri 31 October 2025 |
71.34 (0%) |
70.82 |
70.71 - 71.66 |
0.2182 times |
Fri 31 October 2025 |
71.34 (-4.92%) |
74.93 |
70.71 - 75.53 |
1.4915 times |
Fri 24 October 2025 |
75.03 (1.32%) |
74.30 |
71.12 - 75.55 |
1.6348 times |
Fri 17 October 2025 |
74.05 (-4.64%) |
77.35 |
73.41 - 78.48 |
0.9568 times |
Fri 10 October 2025 |
77.65 (1.03%) |
76.99 |
76.16 - 78.43 |
0.5521 times |
Fri 03 October 2025 |
76.86 (1.29%) |
75.92 |
74.74 - 77.31 |
0.7222 times |

Monthly price and charts WR Strong monthly Stock price targets for WR WRB are 59.72 and 72.39 | Monthly Target 1 | 57.39 | | Monthly Target 2 | 62.05 | | Monthly Target 3 | 70.056666666667 | | Monthly Target 4 | 74.72 | | Monthly Target 5 | 82.73 |
Monthly price and volumes W R
| Date |
Closing |
Open |
Range |
Volume |
Fri 05 December 2025 |
66.72 (-14.12%) |
77.60 |
65.39 - 78.06 |
0.8009 times |
Fri 28 November 2025 |
77.69 (8.9%) |
72.12 |
72.11 - 78.96 |
0.9143 times |
Fri 31 October 2025 |
71.34 (-6.89%) |
76.37 |
70.71 - 78.48 |
1.7705 times |
Tue 30 September 2025 |
76.62 (6.88%) |
71.77 |
70.43 - 76.97 |
0.9399 times |
Fri 29 August 2025 |
71.69 (4.19%) |
69.16 |
68.49 - 73.09 |
0.861 times |
Thu 31 July 2025 |
68.81 (-6.34%) |
73.41 |
66.68 - 73.58 |
1.2718 times |
Mon 30 June 2025 |
73.47 (-1.63%) |
74.14 |
71.09 - 75.44 |
0.7409 times |
Fri 30 May 2025 |
74.69 (4.18%) |
71.03 |
70.16 - 74.93 |
0.7384 times |
Wed 30 April 2025 |
71.69 (0.74%) |
70.81 |
62.63 - 72.00 |
1.0195 times |
Mon 31 March 2025 |
71.16 (12.81%) |
63.03 |
60.68 - 76.38 |
0.943 times |
Fri 28 February 2025 |
63.08 (7.22%) |
58.57 |
58.07 - 63.18 |
0.713 times |

DMA SMA EMA moving averages of W R WRB
DMA (daily moving average) of W R WRB
| DMA period | DMA value | | 5 day DMA | 71 | | 12 day DMA | 74.82 | | 20 day DMA | 75.51 | | 35 day DMA | 74.71 | | 50 day DMA | 75.3 | | 100 day DMA | 73.25 | | 150 day DMA | 72.97 | | 200 day DMA | 71.27 | EMA (exponential moving average) of W R WRB
| EMA period | EMA current | EMA prev | EMA prev2 | | 5 day EMA | 70.83 | 72.88 | 73.88 | | 12 day EMA | 73.37 | 74.58 | 75.25 | | 20 day EMA | 74.27 | 75.06 | 75.5 | | 35 day EMA | 74.9 | 75.38 | 75.65 | | 50 day EMA | 74.74 | 75.07 | 75.24 |
SMA (simple moving average) of W R WRB
| SMA period | SMA current | SMA prev | SMA prev2 | | 5 day SMA | 71 | 73.2 | 74.55 | | 12 day SMA | 74.82 | 75.72 | 76.24 | | 20 day SMA | 75.51 | 75.91 | 76.1 | | 35 day SMA | 74.71 | 74.91 | 75.07 | | 50 day SMA | 75.3 | 75.45 | 75.53 | | 100 day SMA | 73.25 | 73.26 | 73.23 | | 150 day SMA | 72.97 | 73 | 73.01 | | 200 day SMA | 71.27 | 71.24 | 71.19 |
|
|
