WasteManagement WM full analysis,charts,indicators,moving averages,SMA,DMA,EMA,ADX,MACD,RSIWaste Management WM WideScreen charts, DMA,SMA,EMA technical analysis, forecast prediction, by indicators ADX,MACD,RSI,CCI NYSE stock exchange
operates under Public Utilities sector & deals in Environmental Services
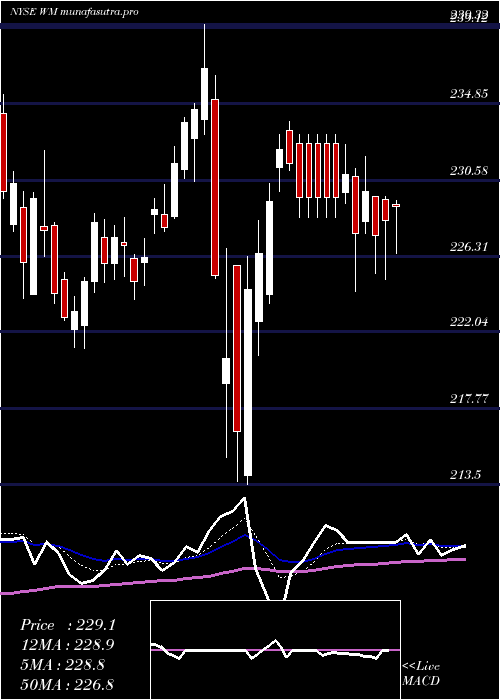
Daily price and charts and targets WasteManagement Strong Daily Stock price targets for WasteManagement WM are 213.84 and 215.66 | Daily Target 1 | 213.48 | | Daily Target 2 | 214.19 | | Daily Target 3 | 215.30333333333 | | Daily Target 4 | 216.01 | | Daily Target 5 | 217.12 |
Daily price and volume Waste Management
| Date |
Closing |
Open |
Range |
Volume |
Tue 21 October 2025 |
214.89 (-0.24%) |
215.15 |
214.60 - 216.42 |
0.8129 times |
Mon 20 October 2025 |
215.40 (-0.04%) |
215.85 |
214.21 - 216.29 |
0.7384 times |
Fri 17 October 2025 |
215.48 (1.03%) |
214.13 |
213.64 - 216.12 |
0.9042 times |
Thu 16 October 2025 |
213.29 (-0.19%) |
213.50 |
211.71 - 214.14 |
0.9379 times |
Wed 15 October 2025 |
213.69 (-2.03%) |
217.60 |
213.00 - 217.77 |
1.3411 times |
Tue 14 October 2025 |
218.11 (0.47%) |
217.46 |
216.80 - 219.20 |
1.0822 times |
Mon 13 October 2025 |
217.09 (-0.99%) |
217.47 |
216.52 - 218.79 |
0.9241 times |
Fri 10 October 2025 |
219.25 (0.79%) |
217.85 |
216.44 - 220.24 |
1.2289 times |
Thu 09 October 2025 |
217.53 (-1.11%) |
219.42 |
216.45 - 219.96 |
1.0346 times |
Wed 08 October 2025 |
219.98 (1.11%) |
217.58 |
217.08 - 220.57 |
0.9957 times |
Tue 07 October 2025 |
217.56 (-0.06%) |
217.64 |
216.15 - 218.26 |
0.8333 times |
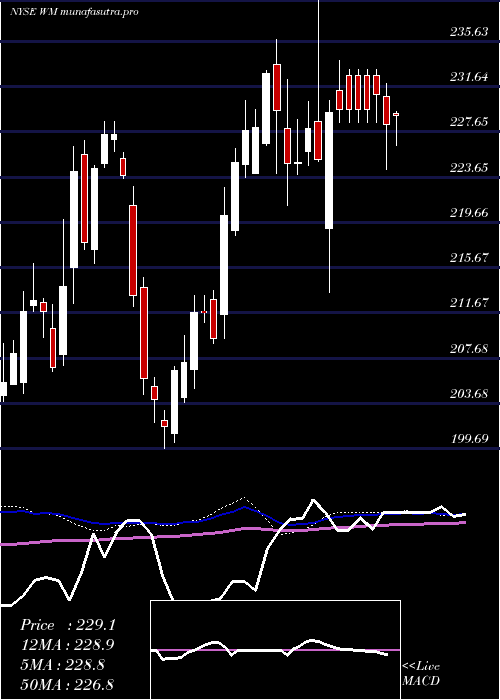
Weekly price and charts WasteManagement Strong weekly Stock price targets for WasteManagement WM are 213.45 and 215.66 | Weekly Target 1 | 212.96 | | Weekly Target 2 | 213.93 | | Weekly Target 3 | 215.17333333333 | | Weekly Target 4 | 216.14 | | Weekly Target 5 | 217.38 |
Weekly price and volumes for Waste Management
| Date |
Closing |
Open |
Range |
Volume |
Tue 21 October 2025 |
214.89 (-0.27%) |
215.85 |
214.21 - 216.42 |
0.3273 times |
Fri 17 October 2025 |
215.48 (-1.72%) |
217.47 |
211.71 - 219.20 |
1.095 times |
Fri 10 October 2025 |
219.25 (-0.23%) |
219.40 |
216.15 - 220.57 |
0.9823 times |
Fri 03 October 2025 |
219.76 (0.49%) |
218.86 |
216.04 - 221.58 |
1.1116 times |
Fri 26 September 2025 |
218.69 (1.06%) |
216.53 |
215.20 - 221.62 |
1.2874 times |
Fri 19 September 2025 |
216.40 (-0.81%) |
218.61 |
213.71 - 219.08 |
1.4537 times |
Fri 12 September 2025 |
218.16 (-0.86%) |
220.01 |
215.45 - 220.79 |
1.1822 times |
Fri 05 September 2025 |
220.06 (-2.8%) |
226.42 |
218.66 - 226.85 |
1.2938 times |
Fri 29 August 2025 |
226.39 (0%) |
224.65 |
224.65 - 226.82 |
0.2529 times |
Fri 29 August 2025 |
226.39 (-0.28%) |
227.39 |
223.32 - 227.98 |
1.0137 times |
Fri 22 August 2025 |
227.02 (0.09%) |
227.43 |
223.87 - 232.58 |
1.5119 times |
Monthly price and charts WasteManagement Strong monthly Stock price targets for WasteManagement WM are 208.53 and 218.07 | Monthly Target 1 | 206.41 | | Monthly Target 2 | 210.65 | | Monthly Target 3 | 215.95 | | Monthly Target 4 | 220.19 | | Monthly Target 5 | 225.49 |
Monthly price and volumes Waste Management
| Date |
Closing |
Open |
Range |
Volume |
Tue 21 October 2025 |
214.89 (-2.69%) |
220.38 |
211.71 - 221.25 |
0.5503 times |
Tue 30 September 2025 |
220.83 (-2.46%) |
226.42 |
213.71 - 226.85 |
1.0315 times |
Fri 29 August 2025 |
226.39 (-1.21%) |
230.86 |
222.46 - 237.27 |
1.0291 times |
Thu 31 July 2025 |
229.16 (0.15%) |
228.52 |
222.15 - 240.39 |
1.1214 times |
Mon 30 June 2025 |
228.82 (-5.04%) |
239.08 |
226.04 - 242.58 |
0.9035 times |
Fri 30 May 2025 |
240.97 (3.26%) |
232.01 |
219.76 - 241.68 |
1.1078 times |
Wed 30 April 2025 |
233.36 (0.8%) |
231.19 |
213.50 - 239.32 |
1.2577 times |
Mon 31 March 2025 |
231.51 (-0.55%) |
233.59 |
221.10 - 235.81 |
0.9424 times |
Fri 28 February 2025 |
232.78 (5.68%) |
218.91 |
218.51 - 233.04 |
0.8558 times |
Fri 31 January 2025 |
220.26 (9.15%) |
202.87 |
199.69 - 222.73 |
1.2004 times |
Tue 31 December 2024 |
201.79 (-11.28%) |
225.26 |
200.86 - 225.81 |
0.8113 times |

DMA SMA EMA moving averages of Waste Management WM
DMA (daily moving average) of Waste Management WM
| DMA period | DMA value | | 5 day DMA | 214.55 | | 12 day DMA | 216.66 | | 20 day DMA | 217.6 | | 35 day DMA | 217.98 | | 50 day DMA | 220.59 | | 100 day DMA | 225.98 | | 150 day DMA | 227.32 | | 200 day DMA | 225.75 | EMA (exponential moving average) of Waste Management WM
| EMA period | EMA current | EMA prev | EMA prev2 | | 5 day EMA | 215.28 | 215.47 | 215.51 | | 12 day EMA | 216.28 | 216.53 | 216.73 | | 20 day EMA | 217.19 | 217.43 | 217.64 | | 35 day EMA | 219.36 | 219.62 | 219.87 | | 50 day EMA | 221.1 | 221.35 | 221.59 |
SMA (simple moving average) of Waste Management WM
| SMA period | SMA current | SMA prev | SMA prev2 | | 5 day SMA | 214.55 | 215.19 | 215.53 | | 12 day SMA | 216.66 | 217.07 | 217.19 | | 20 day SMA | 217.6 | 217.77 | 217.85 | | 35 day SMA | 217.98 | 218.29 | 218.6 | | 50 day SMA | 220.59 | 220.95 | 221.39 | | 100 day SMA | 225.98 | 226.2 | 226.43 | | 150 day SMA | 227.32 | 227.39 | 227.48 | | 200 day SMA | 225.75 | 225.69 | 225.62 |
|
|
