WellsFargo WFC-L full analysis,charts,indicators,moving averages,SMA,DMA,EMA,ADX,MACD,RSIWells Fargo WFC-L WideScreen charts, DMA,SMA,EMA technical analysis, forecast prediction, by indicators ADX,MACD,RSI,CCI NYSE stock exchange
Daily price and charts and targets WellsFargo Strong Daily Stock price targets for WellsFargo WFC-L are 1221.79 and 1224.69 | Daily Target 1 | 1219.46 | | Daily Target 2 | 1221.22 | | Daily Target 3 | 1222.36 | | Daily Target 4 | 1224.12 | | Daily Target 5 | 1225.26 |
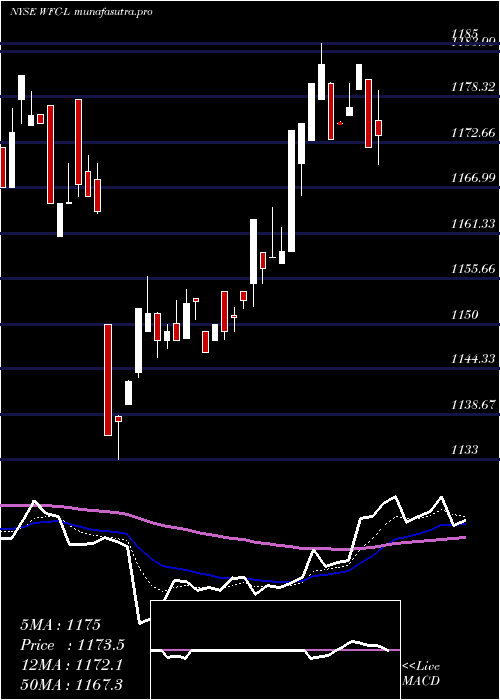
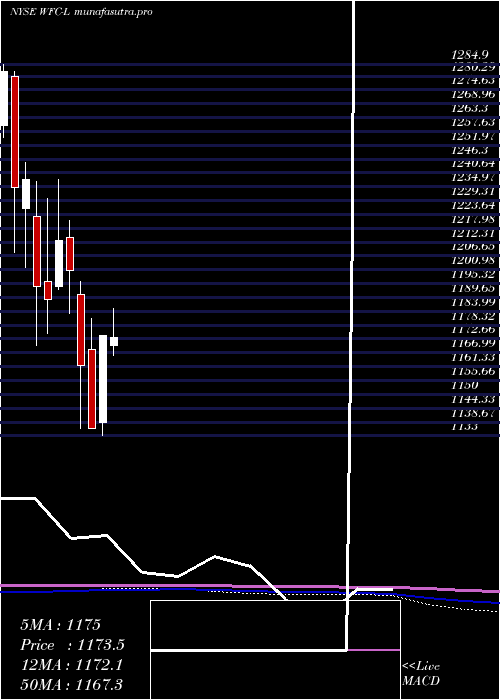
Daily price and volume Wells Fargo
| Date |
Closing |
Open |
Range |
Volume |
Thu 04 December 2025 |
1222.98 (-0%) |
1221.64 |
1220.60 - 1223.50 |
0.937 times |
Wed 03 December 2025 |
1223.00 (-0.07%) |
1221.31 |
1221.00 - 1224.00 |
0.7916 times |
Tue 02 December 2025 |
1223.89 (0.2%) |
1225.19 |
1221.00 - 1225.19 |
0.6462 times |
Mon 01 December 2025 |
1221.50 (0.12%) |
1221.00 |
1219.00 - 1227.50 |
0.9047 times |
Fri 28 November 2025 |
1220.01 (-2.27%) |
1235.00 |
1220.01 - 1235.00 |
1.7609 times |
Wed 26 November 2025 |
1248.34 (0.25%) |
1247.00 |
1243.30 - 1250.00 |
0.7431 times |
Tue 25 November 2025 |
1245.20 (0.23%) |
1244.97 |
1241.71 - 1254.14 |
0.9855 times |
Mon 24 November 2025 |
1242.30 (1.02%) |
1228.65 |
1228.65 - 1245.99 |
1.7932 times |
Fri 21 November 2025 |
1229.70 (-0.04%) |
1232.25 |
1223.00 - 1232.25 |
0.7754 times |
Thu 20 November 2025 |
1230.23 (0.03%) |
1229.26 |
1226.20 - 1238.70 |
0.6624 times |
Wed 19 November 2025 |
1229.80 (-0.34%) |
1231.31 |
1226.22 - 1233.40 |
1.6317 times |
Weekly price and charts WellsFargo Strong weekly Stock price targets for WellsFargo WFC-L are 1220.99 and 1229.49 | Weekly Target 1 | 1214.66 | | Weekly Target 2 | 1218.82 | | Weekly Target 3 | 1223.16 | | Weekly Target 4 | 1227.32 | | Weekly Target 5 | 1231.66 |
Weekly price and volumes for Wells Fargo
| Date |
Closing |
Open |
Range |
Volume |
Thu 04 December 2025 |
1222.98 (0.24%) |
1221.00 |
1219.00 - 1227.50 |
0.7395 times |
Fri 28 November 2025 |
1220.01 (-0.79%) |
1228.65 |
1220.01 - 1254.14 |
1.1913 times |
Fri 21 November 2025 |
1229.70 (0.38%) |
1227.15 |
1222.49 - 1238.70 |
1.0346 times |
Fri 14 November 2025 |
1225.00 (-1.25%) |
1239.72 |
1225.00 - 1249.99 |
0.7322 times |
Fri 07 November 2025 |
1240.50 (0.26%) |
1235.79 |
1230.01 - 1243.09 |
1.3698 times |
Fri 31 October 2025 |
1237.25 (0%) |
1238.50 |
1237.25 - 1239.75 |
0.1129 times |
Fri 31 October 2025 |
1237.25 (-0.3%) |
1242.21 |
1233.23 - 1244.99 |
1.0528 times |
Fri 24 October 2025 |
1241.00 (-0.48%) |
1248.00 |
1236.00 - 1249.00 |
1.2131 times |
Fri 17 October 2025 |
1246.99 (1.84%) |
1231.01 |
1224.00 - 1249.99 |
1.5628 times |
Fri 10 October 2025 |
1224.49 (-1.84%) |
1248.02 |
1224.00 - 1253.95 |
0.9909 times |
Fri 03 October 2025 |
1247.50 (0.83%) |
1238.17 |
1234.29 - 1249.13 |
1.3115 times |

Monthly price and charts WellsFargo Strong monthly Stock price targets for WellsFargo WFC-L are 1220.99 and 1229.49 | Monthly Target 1 | 1214.66 | | Monthly Target 2 | 1218.82 | | Monthly Target 3 | 1223.16 | | Monthly Target 4 | 1227.32 | | Monthly Target 5 | 1231.66 |
Monthly price and volumes Wells Fargo
| Date |
Closing |
Open |
Range |
Volume |
Thu 04 December 2025 |
1222.98 (0.24%) |
1221.00 |
1219.00 - 1227.50 |
0.1588 times |
Fri 28 November 2025 |
1220.01 (-1.39%) |
1235.79 |
1220.01 - 1254.14 |
0.9291 times |
Fri 31 October 2025 |
1237.25 (0.24%) |
1237.88 |
1224.00 - 1253.95 |
1.1919 times |
Tue 30 September 2025 |
1234.29 (1.59%) |
1214.39 |
1212.50 - 1271.52 |
1.0089 times |
Fri 29 August 2025 |
1215.00 (2.57%) |
1184.47 |
1184.47 - 1241.35 |
0.9197 times |
Thu 31 July 2025 |
1184.54 (0.89%) |
1170.00 |
1166.01 - 1194.80 |
1.1339 times |
Mon 30 June 2025 |
1174.13 (3.36%) |
1138.53 |
1133.00 - 1174.13 |
1.0628 times |
Fri 30 May 2025 |
1136.00 (-2.24%) |
1168.50 |
1136.00 - 1181.00 |
1.2842 times |
Wed 30 April 2025 |
1162.00 (-3.23%) |
1190.81 |
1136.18 - 1195.99 |
1.3942 times |
Mon 31 March 2025 |
1200.80 (-1.02%) |
1214.20 |
1183.02 - 1221.07 |
0.9166 times |
Fri 28 February 2025 |
1213.15 (2.04%) |
1194.06 |
1193.00 - 1238.00 |
0.7805 times |
DMA SMA EMA moving averages of Wells Fargo WFC-L
DMA (daily moving average) of Wells Fargo WFC-L
| DMA period | DMA value | | 5 day DMA | 1222.28 | | 12 day DMA | 1230.91 | | 20 day DMA | 1233.37 | | 35 day DMA | 1236.23 | | 50 day DMA | 1238.13 | | 100 day DMA | 1227.35 | | 150 day DMA | 1206.17 | | 200 day DMA | 1202.26 | EMA (exponential moving average) of Wells Fargo WFC-L
| EMA period | EMA current | EMA prev | EMA prev2 | | 5 day EMA | 1225.21 | 1226.33 | 1228 | | 12 day EMA | 1229.25 | 1230.39 | 1231.73 | | 20 day EMA | 1231.88 | 1232.82 | 1233.85 | | 35 day EMA | 1235.59 | 1236.33 | 1237.12 | | 50 day EMA | 1238.3 | 1238.92 | 1239.57 |
SMA (simple moving average) of Wells Fargo WFC-L
| SMA period | SMA current | SMA prev | SMA prev2 | | 5 day SMA | 1222.28 | 1227.35 | 1231.79 | | 12 day SMA | 1230.91 | 1230.98 | 1231.15 | | 20 day SMA | 1233.37 | 1233.92 | 1234.55 | | 35 day SMA | 1236.23 | 1236.88 | 1237.15 | | 50 day SMA | 1238.13 | 1238.97 | 1239.64 | | 100 day SMA | 1227.35 | 1226.84 | 1226.43 | | 150 day SMA | 1206.17 | 1205.89 | 1205.59 | | 200 day SMA | 1202.26 | 1202.23 | 1202.17 |
|
|
