WellsFargo WFC-A full analysis,charts,indicators,moving averages,SMA,DMA,EMA,ADX,MACD,RSIWells Fargo WFC-A WideScreen charts, DMA,SMA,EMA technical analysis, forecast prediction, by indicators ADX,MACD,RSI,CCI NYSE stock exchange
Daily price and charts and targets WellsFargo Strong Daily Stock price targets for WellsFargo WFC-A are 18.85 and 18.95 | Daily Target 1 | 18.77 | | Daily Target 2 | 18.82 | | Daily Target 3 | 18.866666666667 | | Daily Target 4 | 18.92 | | Daily Target 5 | 18.97 |
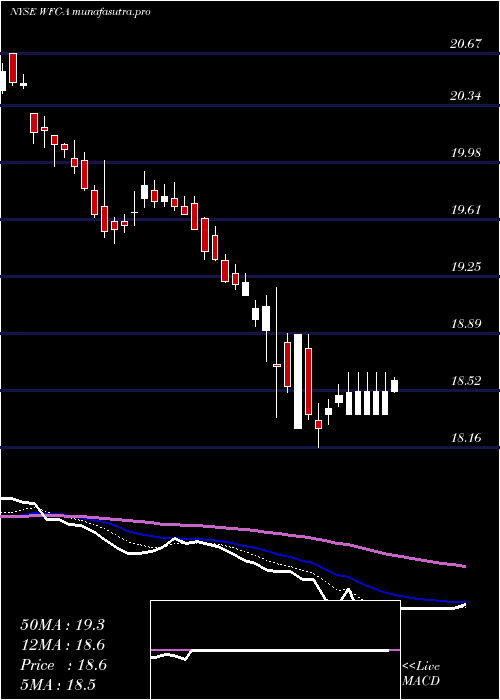
Daily price and volume Wells Fargo
| Date |
Closing |
Open |
Range |
Volume |
Fri 05 December 2025 |
18.88 (0.32%) |
18.82 |
18.81 - 18.91 |
1.0887 times |
Thu 04 December 2025 |
18.82 (-0.26%) |
18.81 |
18.80 - 18.90 |
0.637 times |
Wed 03 December 2025 |
18.87 (0.16%) |
18.81 |
18.75 - 18.88 |
1.7219 times |
Tue 02 December 2025 |
18.84 (-0.05%) |
18.85 |
18.75 - 18.90 |
3.7355 times |
Mon 01 December 2025 |
18.85 (-0.63%) |
18.89 |
18.84 - 18.95 |
0.5522 times |
Fri 28 November 2025 |
18.97 (-2.42%) |
19.16 |
18.95 - 19.19 |
0.8189 times |
Wed 26 November 2025 |
19.44 (0.78%) |
19.38 |
19.30 - 19.45 |
0.2839 times |
Tue 25 November 2025 |
19.29 (0%) |
19.26 |
19.20 - 19.33 |
0.4298 times |
Mon 24 November 2025 |
19.29 (0.94%) |
19.13 |
19.13 - 19.29 |
0.3911 times |
Fri 21 November 2025 |
19.11 (0.26%) |
19.08 |
19.07 - 19.22 |
0.341 times |
Thu 20 November 2025 |
19.06 (-0.37%) |
19.17 |
19.00 - 19.27 |
0.5991 times |
Weekly price and charts WellsFargo Strong weekly Stock price targets for WellsFargo WFC-A are 18.72 and 18.92 | Weekly Target 1 | 18.66 | | Weekly Target 2 | 18.77 | | Weekly Target 3 | 18.86 | | Weekly Target 4 | 18.97 | | Weekly Target 5 | 19.06 |
Weekly price and volumes for Wells Fargo
| Date |
Closing |
Open |
Range |
Volume |
Fri 05 December 2025 |
18.88 (-0.47%) |
18.89 |
18.75 - 18.95 |
3.7981 times |
Fri 28 November 2025 |
18.97 (-0.73%) |
19.13 |
18.95 - 19.45 |
0.9445 times |
Fri 21 November 2025 |
19.11 (-1.44%) |
19.36 |
19.00 - 19.39 |
0.9419 times |
Fri 14 November 2025 |
19.39 (-1.47%) |
19.75 |
19.25 - 19.82 |
0.7621 times |
Fri 07 November 2025 |
19.68 (-0.35%) |
19.49 |
19.49 - 19.78 |
0.4042 times |
Fri 31 October 2025 |
19.75 (0%) |
19.86 |
19.72 - 19.95 |
0.1367 times |
Fri 31 October 2025 |
19.75 (-0.9%) |
19.98 |
19.68 - 20.03 |
0.8103 times |
Fri 24 October 2025 |
19.93 (0.91%) |
19.86 |
19.71 - 20.00 |
0.7335 times |
Fri 17 October 2025 |
19.75 (1.13%) |
19.65 |
19.55 - 19.82 |
0.535 times |
Fri 10 October 2025 |
19.53 (-1.06%) |
19.70 |
19.51 - 19.86 |
0.9336 times |
Fri 03 October 2025 |
19.74 (0.05%) |
19.76 |
19.59 - 19.96 |
0.5451 times |

Monthly price and charts WellsFargo Strong monthly Stock price targets for WellsFargo WFC-A are 18.72 and 18.92 | Monthly Target 1 | 18.66 | | Monthly Target 2 | 18.77 | | Monthly Target 3 | 18.86 | | Monthly Target 4 | 18.97 | | Monthly Target 5 | 19.06 |
Monthly price and volumes Wells Fargo
| Date |
Closing |
Open |
Range |
Volume |
Fri 05 December 2025 |
18.88 (-0.47%) |
18.89 |
18.75 - 18.95 |
0.99 times |
Fri 28 November 2025 |
18.97 (-3.95%) |
19.49 |
18.95 - 19.82 |
0.7957 times |
Fri 31 October 2025 |
19.75 (0.82%) |
19.61 |
19.51 - 20.03 |
0.8804 times |
Tue 30 September 2025 |
19.59 (2.24%) |
19.12 |
19.02 - 20.22 |
1.0058 times |
Fri 29 August 2025 |
19.16 (0.26%) |
19.11 |
19.02 - 19.88 |
1.083 times |
Thu 31 July 2025 |
19.11 (1.49%) |
18.86 |
18.60 - 19.32 |
1.3815 times |
Mon 30 June 2025 |
18.83 (3.92%) |
18.12 |
18.00 - 18.95 |
1.0681 times |
Fri 30 May 2025 |
18.12 (-2.89%) |
18.73 |
18.07 - 18.84 |
1.1471 times |
Wed 30 April 2025 |
18.66 (-2.91%) |
19.27 |
18.16 - 19.33 |
0.8438 times |
Mon 31 March 2025 |
19.22 (-4.71%) |
20.20 |
19.21 - 20.27 |
0.8046 times |
Fri 28 February 2025 |
20.17 (0.9%) |
19.85 |
19.73 - 20.67 |
0.6496 times |

DMA SMA EMA moving averages of Wells Fargo WFC-A
DMA (daily moving average) of Wells Fargo WFC-A
| DMA period | DMA value | | 5 day DMA | 18.85 | | 12 day DMA | 19.05 | | 20 day DMA | 19.22 | | 35 day DMA | 19.48 | | 50 day DMA | 19.55 | | 100 day DMA | 19.47 | | 150 day DMA | 19.19 | | 200 day DMA | 19.22 | EMA (exponential moving average) of Wells Fargo WFC-A
| EMA period | EMA current | EMA prev | EMA prev2 | | 5 day EMA | 18.9 | 18.91 | 18.96 | | 12 day EMA | 19.04 | 19.07 | 19.11 | | 20 day EMA | 19.17 | 19.2 | 19.24 | | 35 day EMA | 19.33 | 19.36 | 19.39 | | 50 day EMA | 19.5 | 19.53 | 19.56 |
SMA (simple moving average) of Wells Fargo WFC-A
| SMA period | SMA current | SMA prev | SMA prev2 | | 5 day SMA | 18.85 | 18.87 | 18.99 | | 12 day SMA | 19.05 | 19.08 | 19.1 | | 20 day SMA | 19.22 | 19.26 | 19.3 | | 35 day SMA | 19.48 | 19.5 | 19.53 | | 50 day SMA | 19.55 | 19.57 | 19.59 | | 100 day SMA | 19.47 | 19.47 | 19.47 | | 150 day SMA | 19.19 | 19.19 | 19.19 | | 200 day SMA | 19.22 | 19.23 | 19.23 |
|
|
