WellsFargo WFC full analysis,charts,indicators,moving averages,SMA,DMA,EMA,ADX,MACD,RSIWells Fargo WFC WideScreen charts, DMA,SMA,EMA technical analysis, forecast prediction, by indicators ADX,MACD,RSI,CCI NYSE stock exchange
operates under Finance sector & deals in Major Banks
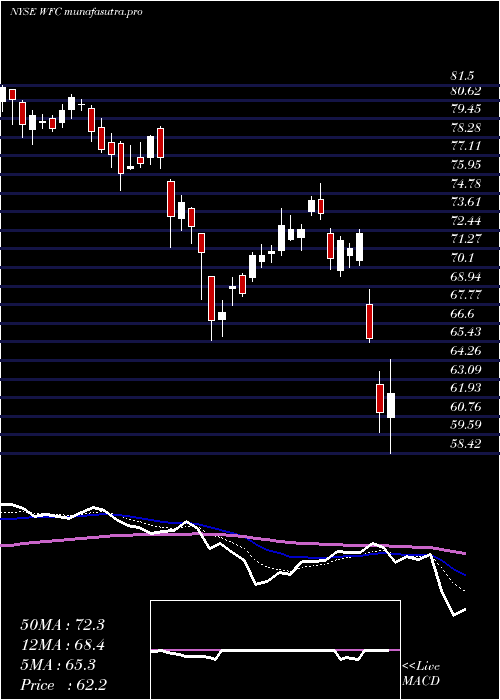
Daily price and charts and targets WellsFargo Strong Daily Stock price targets for WellsFargo WFC are 88.91 and 90.47 | Daily Target 1 | 88.6 | | Daily Target 2 | 89.22 | | Daily Target 3 | 90.163333333333 | | Daily Target 4 | 90.78 | | Daily Target 5 | 91.72 |
Daily price and volume Wells Fargo
| Date |
Closing |
Open |
Range |
Volume |
Fri 05 December 2025 |
89.83 (-0.43%) |
89.99 |
89.55 - 91.11 |
1.0551 times |
Thu 04 December 2025 |
90.22 (0.97%) |
89.50 |
89.32 - 90.63 |
0.7282 times |
Wed 03 December 2025 |
89.35 (3.5%) |
86.26 |
86.26 - 89.39 |
1.3589 times |
Tue 02 December 2025 |
86.33 (1.09%) |
85.66 |
85.28 - 86.79 |
0.4688 times |
Mon 01 December 2025 |
85.40 (-0.52%) |
85.83 |
85.17 - 86.56 |
0.9217 times |
Fri 28 November 2025 |
85.85 (0.34%) |
85.64 |
85.31 - 86.52 |
0.616 times |
Wed 26 November 2025 |
85.56 (0.54%) |
85.42 |
85.13 - 86.39 |
0.8756 times |
Tue 25 November 2025 |
85.10 (0.63%) |
84.53 |
83.61 - 85.54 |
1.2203 times |
Mon 24 November 2025 |
84.57 (1.76%) |
83.37 |
82.41 - 85.09 |
1.2364 times |
Fri 21 November 2025 |
83.11 (0.86%) |
82.77 |
81.05 - 83.63 |
1.5191 times |
Thu 20 November 2025 |
82.40 (-2.09%) |
85.06 |
82.32 - 86.04 |
1.1421 times |
Weekly price and charts WellsFargo Strong weekly Stock price targets for WellsFargo WFC are 87.5 and 93.44 | Weekly Target 1 | 82.76 | | Weekly Target 2 | 86.3 | | Weekly Target 3 | 88.703333333333 | | Weekly Target 4 | 92.24 | | Weekly Target 5 | 94.64 |
Weekly price and volumes for Wells Fargo
| Date |
Closing |
Open |
Range |
Volume |
Fri 05 December 2025 |
89.83 (4.64%) |
85.83 |
85.17 - 91.11 |
0.8103 times |
Fri 28 November 2025 |
85.85 (3.3%) |
83.37 |
82.41 - 86.52 |
0.7058 times |
Fri 21 November 2025 |
83.11 (-2.28%) |
84.68 |
81.05 - 86.04 |
1.1428 times |
Fri 14 November 2025 |
85.05 (-1.14%) |
86.29 |
82.96 - 88.64 |
1.154 times |
Fri 07 November 2025 |
86.03 (-1.08%) |
86.50 |
84.04 - 88.50 |
0.863 times |
Fri 31 October 2025 |
86.97 (0%) |
85.48 |
85.01 - 87.35 |
0.2486 times |
Fri 31 October 2025 |
86.97 (0.65%) |
86.90 |
85.01 - 87.35 |
1.1934 times |
Fri 24 October 2025 |
86.41 (3.76%) |
83.85 |
83.09 - 87.31 |
1.0865 times |
Fri 17 October 2025 |
83.28 (7.29%) |
78.74 |
78.28 - 87.47 |
1.8544 times |
Fri 10 October 2025 |
77.62 (-3.78%) |
81.00 |
77.62 - 81.46 |
0.9412 times |
Fri 03 October 2025 |
80.67 (-5.11%) |
84.70 |
80.04 - 85.19 |
0.9611 times |

Monthly price and charts WellsFargo Strong monthly Stock price targets for WellsFargo WFC are 87.5 and 93.44 | Monthly Target 1 | 82.76 | | Monthly Target 2 | 86.3 | | Monthly Target 3 | 88.703333333333 | | Monthly Target 4 | 92.24 | | Monthly Target 5 | 94.64 |
Monthly price and volumes Wells Fargo
| Date |
Closing |
Open |
Range |
Volume |
Fri 05 December 2025 |
89.83 (4.64%) |
85.83 |
85.17 - 91.11 |
0.156 times |
Fri 28 November 2025 |
85.85 (-1.29%) |
86.50 |
81.05 - 88.64 |
0.744 times |
Fri 31 October 2025 |
86.97 (3.76%) |
83.10 |
77.62 - 87.47 |
1.1409 times |
Tue 30 September 2025 |
83.82 (2%) |
81.71 |
78.56 - 86.65 |
0.9605 times |
Fri 29 August 2025 |
82.18 (1.92%) |
79.19 |
76.16 - 83.21 |
0.9154 times |
Thu 31 July 2025 |
80.63 (0.64%) |
80.05 |
77.72 - 84.83 |
1.3515 times |
Mon 30 June 2025 |
80.12 (7.14%) |
74.25 |
71.93 - 81.10 |
1.1005 times |
Fri 30 May 2025 |
74.78 (5.31%) |
70.75 |
70.43 - 76.58 |
0.9901 times |
Wed 30 April 2025 |
71.01 (-1.09%) |
70.84 |
58.42 - 72.48 |
1.5299 times |
Mon 31 March 2025 |
71.79 (-8.34%) |
78.86 |
65.52 - 78.98 |
1.1113 times |
Fri 28 February 2025 |
78.32 (-0.61%) |
77.23 |
74.93 - 81.50 |
0.9678 times |
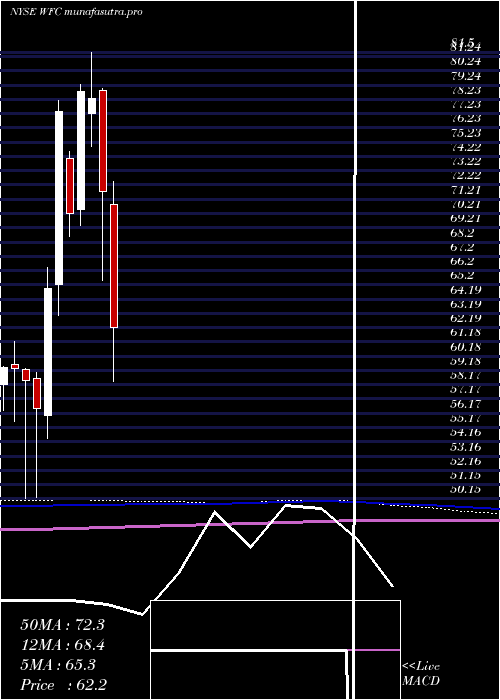
DMA SMA EMA moving averages of Wells Fargo WFC
DMA (daily moving average) of Wells Fargo WFC
| DMA period | DMA value | | 5 day DMA | 88.23 | | 12 day DMA | 85.99 | | 20 day DMA | 85.67 | | 35 day DMA | 85.78 | | 50 day DMA | 84.61 | | 100 day DMA | 82.71 | | 150 day DMA | 80.7 | | 200 day DMA | 77.97 | EMA (exponential moving average) of Wells Fargo WFC
| EMA period | EMA current | EMA prev | EMA prev2 | | 5 day EMA | 88.58 | 87.96 | 86.83 | | 12 day EMA | 87 | 86.48 | 85.8 | | 20 day EMA | 86.28 | 85.91 | 85.46 | | 35 day EMA | 85.41 | 85.15 | 84.85 | | 50 day EMA | 84.99 | 84.79 | 84.57 |
SMA (simple moving average) of Wells Fargo WFC
| SMA period | SMA current | SMA prev | SMA prev2 | | 5 day SMA | 88.23 | 87.43 | 86.5 | | 12 day SMA | 85.99 | 85.49 | 84.93 | | 20 day SMA | 85.67 | 85.49 | 85.32 | | 35 day SMA | 85.78 | 85.61 | 85.5 | | 50 day SMA | 84.61 | 84.5 | 84.38 | | 100 day SMA | 82.71 | 82.61 | 82.5 | | 150 day SMA | 80.7 | 80.58 | 80.45 | | 200 day SMA | 77.97 | 77.92 | 77.87 |
|
|
