WexInc WEX full analysis,charts,indicators,moving averages,SMA,DMA,EMA,ADX,MACD,RSIWex Inc WEX WideScreen charts, DMA,SMA,EMA technical analysis, forecast prediction, by indicators ADX,MACD,RSI,CCI NYSE stock exchange
operates under Miscellaneous sector & deals in Business Services
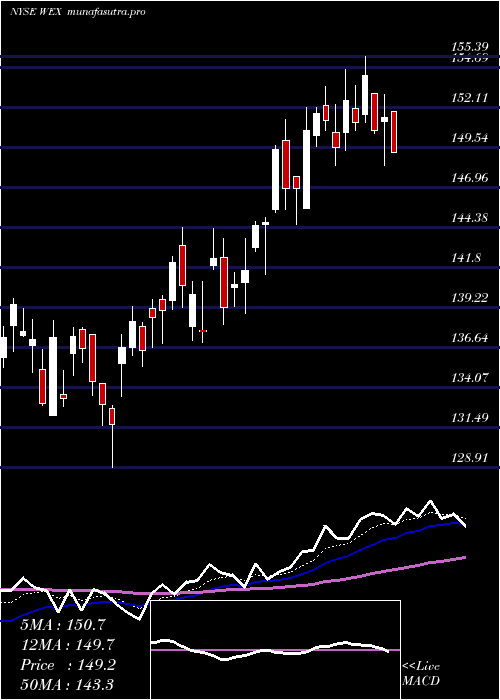
Daily price and charts and targets WexInc Strong Daily Stock price targets for WexInc WEX are 149.67 and 153.43 | Daily Target 1 | 146.62 | | Daily Target 2 | 148.95 | | Daily Target 3 | 150.38 | | Daily Target 4 | 152.71 | | Daily Target 5 | 154.14 |
Daily price and volume Wex Inc
| Date |
Closing |
Open |
Range |
Volume |
Thu 04 December 2025 |
151.28 (1.28%) |
149.53 |
148.05 - 151.81 |
1.0457 times |
Wed 03 December 2025 |
149.37 (1.91%) |
147.06 |
146.09 - 149.67 |
0.9684 times |
Tue 02 December 2025 |
146.57 (0.06%) |
147.25 |
142.86 - 150.00 |
1.158 times |
Mon 01 December 2025 |
146.48 (-1.27%) |
147.14 |
145.44 - 151.23 |
1.9155 times |
Fri 28 November 2025 |
148.36 (-0.2%) |
149.20 |
147.21 - 149.80 |
0.3731 times |
Wed 26 November 2025 |
148.66 (-0.64%) |
148.62 |
148.19 - 150.81 |
0.7567 times |
Tue 25 November 2025 |
149.62 (2.03%) |
147.37 |
145.23 - 149.74 |
0.8796 times |
Mon 24 November 2025 |
146.65 (0.41%) |
144.82 |
143.89 - 147.73 |
0.7922 times |
Fri 21 November 2025 |
146.05 (4.43%) |
140.43 |
140.41 - 147.47 |
1.0369 times |
Thu 20 November 2025 |
139.86 (0.56%) |
139.88 |
139.19 - 144.81 |
1.0739 times |
Wed 19 November 2025 |
139.08 (1.84%) |
136.42 |
135.85 - 139.40 |
0.9697 times |
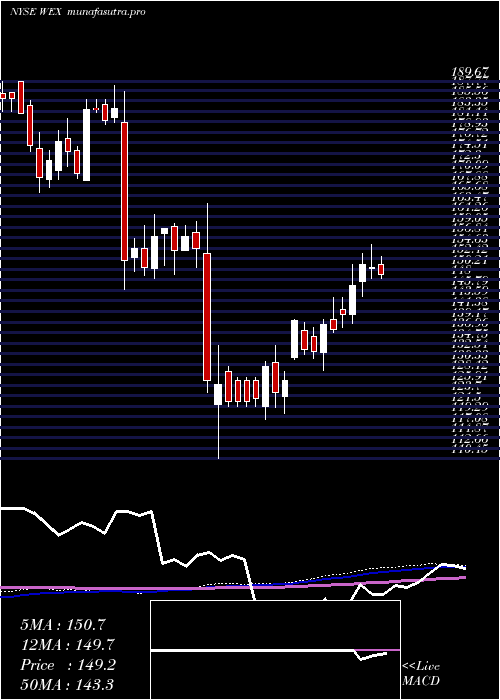
Weekly price and charts WexInc Strong weekly Stock price targets for WexInc WEX are 147.07 and 156.02 | Weekly Target 1 | 139.7 | | Weekly Target 2 | 145.49 | | Weekly Target 3 | 148.65 | | Weekly Target 4 | 154.44 | | Weekly Target 5 | 157.6 |
Weekly price and volumes for Wex Inc
| Date |
Closing |
Open |
Range |
Volume |
Thu 04 December 2025 |
151.28 (1.97%) |
147.14 |
142.86 - 151.81 |
1.1754 times |
Fri 28 November 2025 |
148.36 (1.58%) |
144.82 |
143.89 - 150.81 |
0.6472 times |
Fri 21 November 2025 |
146.05 (6.68%) |
136.85 |
133.65 - 147.47 |
1.3924 times |
Fri 14 November 2025 |
136.91 (-6.02%) |
146.38 |
136.10 - 149.91 |
1.5628 times |
Fri 07 November 2025 |
145.68 (-0.14%) |
149.87 |
143.67 - 150.84 |
0.8829 times |
Fri 31 October 2025 |
145.88 (0%) |
148.85 |
142.19 - 150.29 |
0.3503 times |
Fri 31 October 2025 |
145.88 (-8.76%) |
161.44 |
142.19 - 163.51 |
1.4901 times |
Fri 24 October 2025 |
159.88 (6.23%) |
151.37 |
150.94 - 162.49 |
0.819 times |
Fri 17 October 2025 |
150.51 (0.17%) |
153.05 |
146.74 - 153.88 |
0.9634 times |
Fri 10 October 2025 |
150.25 (-5.89%) |
160.60 |
149.58 - 160.85 |
0.7165 times |
Fri 03 October 2025 |
159.65 (-0.57%) |
162.03 |
156.09 - 162.03 |
0.6609 times |
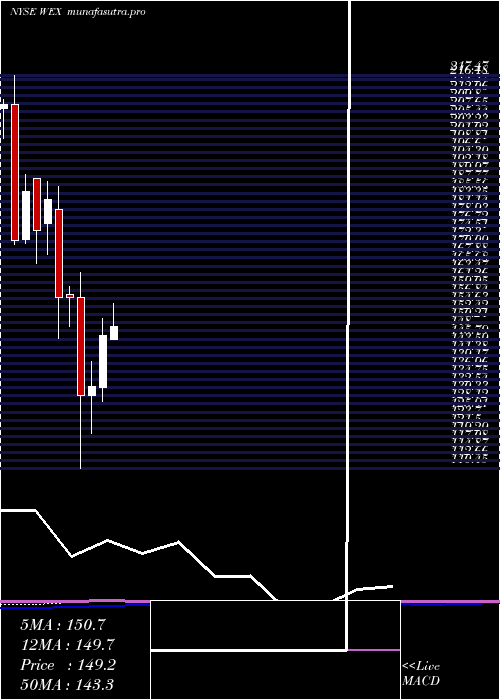
Monthly price and charts WexInc Strong monthly Stock price targets for WexInc WEX are 147.07 and 156.02 | Monthly Target 1 | 139.7 | | Monthly Target 2 | 145.49 | | Monthly Target 3 | 148.65 | | Monthly Target 4 | 154.44 | | Monthly Target 5 | 157.6 |
Monthly price and volumes Wex Inc
| Date |
Closing |
Open |
Range |
Volume |
Thu 04 December 2025 |
151.28 (1.97%) |
147.14 |
142.86 - 151.81 |
0.1824 times |
Fri 28 November 2025 |
148.36 (1.7%) |
149.87 |
133.65 - 150.84 |
0.6961 times |
Fri 31 October 2025 |
145.88 (-7.4%) |
156.93 |
142.19 - 163.51 |
0.7399 times |
Tue 30 September 2025 |
157.53 (-8.07%) |
169.69 |
156.09 - 176.95 |
0.6602 times |
Fri 29 August 2025 |
171.35 (0.98%) |
167.96 |
163.03 - 177.00 |
0.6794 times |
Thu 31 July 2025 |
169.68 (15.52%) |
145.59 |
145.59 - 180.71 |
0.9722 times |
Mon 30 June 2025 |
146.89 (10.5%) |
132.69 |
128.91 - 151.33 |
0.9852 times |
Fri 30 May 2025 |
132.93 (1.96%) |
130.53 |
120.03 - 139.76 |
0.9464 times |
Wed 30 April 2025 |
130.37 (-16.97%) |
157.00 |
110.45 - 164.04 |
1.7902 times |
Mon 31 March 2025 |
157.02 (-0.05%) |
157.82 |
149.17 - 160.20 |
2.348 times |
Fri 28 February 2025 |
157.10 (-14.57%) |
181.04 |
146.03 - 187.44 |
1.2388 times |
DMA SMA EMA moving averages of Wex Inc WEX
DMA (daily moving average) of Wex Inc WEX
| DMA period | DMA value | | 5 day DMA | 148.41 | | 12 day DMA | 145.71 | | 20 day DMA | 144.6 | | 35 day DMA | 148.21 | | 50 day DMA | 150.74 | | 100 day DMA | 159.77 | | 150 day DMA | 152.93 | | 200 day DMA | 150.48 | EMA (exponential moving average) of Wex Inc WEX
| EMA period | EMA current | EMA prev | EMA prev2 | | 5 day EMA | 148.85 | 147.64 | 146.78 | | 12 day EMA | 147.08 | 146.32 | 145.77 | | 20 day EMA | 146.99 | 146.54 | 146.24 | | 35 day EMA | 148.75 | 148.6 | 148.55 | | 50 day EMA | 151.54 | 151.55 | 151.64 |
SMA (simple moving average) of Wex Inc WEX
| SMA period | SMA current | SMA prev | SMA prev2 | | 5 day SMA | 148.41 | 147.89 | 147.94 | | 12 day SMA | 145.71 | 144.47 | 143.43 | | 20 day SMA | 144.6 | 144.46 | 144.4 | | 35 day SMA | 148.21 | 148.18 | 148.26 | | 50 day SMA | 150.74 | 150.94 | 151.14 | | 100 day SMA | 159.77 | 159.75 | 159.77 | | 150 day SMA | 152.93 | 152.79 | 152.68 | | 200 day SMA | 150.48 | 150.52 | 150.55 |
|
|
