WesternMidstream WES full analysis,charts,indicators,moving averages,SMA,DMA,EMA,ADX,MACD,RSIWestern Midstream WES WideScreen charts, DMA,SMA,EMA technical analysis, forecast prediction, by indicators ADX,MACD,RSI,CCI NYSE stock exchange
operates under Public Utilities sector & deals in Natural Gas Distribution
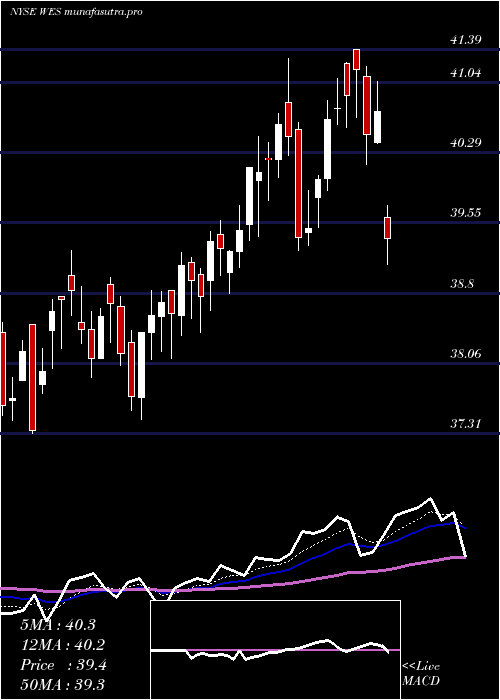
Daily price and charts and targets WesternMidstream Strong Daily Stock price targets for WesternMidstream WES are 39.44 and 40.28 | Daily Target 1 | 39.26 | | Daily Target 2 | 39.62 | | Daily Target 3 | 40.096666666667 | | Daily Target 4 | 40.46 | | Daily Target 5 | 40.94 |
Daily price and volume Western Midstream
| Date |
Closing |
Open |
Range |
Volume |
Fri 05 December 2025 |
39.99 (-0.77%) |
40.30 |
39.73 - 40.57 |
1.1611 times |
Thu 04 December 2025 |
40.30 (2.73%) |
39.42 |
39.26 - 40.48 |
1.3693 times |
Wed 03 December 2025 |
39.23 (1.13%) |
39.12 |
38.97 - 39.40 |
1.9244 times |
Tue 02 December 2025 |
38.79 (-1.37%) |
39.43 |
38.79 - 39.43 |
0.6187 times |
Mon 01 December 2025 |
39.33 (0%) |
39.10 |
39.10 - 39.56 |
1.0285 times |
Fri 28 November 2025 |
39.33 (0.85%) |
39.12 |
39.12 - 39.73 |
0.645 times |
Wed 26 November 2025 |
39.00 (0%) |
39.07 |
39.00 - 39.46 |
0.8811 times |
Tue 25 November 2025 |
39.00 (0.18%) |
38.93 |
38.77 - 39.31 |
0.9414 times |
Mon 24 November 2025 |
38.93 (-0.08%) |
39.21 |
38.68 - 39.21 |
0.8289 times |
Fri 21 November 2025 |
38.96 (0.13%) |
39.00 |
38.60 - 39.05 |
0.6017 times |
Thu 20 November 2025 |
38.91 (-0.23%) |
39.01 |
38.66 - 39.30 |
0.9354 times |
Weekly price and charts WesternMidstream Strong weekly Stock price targets for WesternMidstream WES are 39.39 and 41.17 | Weekly Target 1 | 38 | | Weekly Target 2 | 39 | | Weekly Target 3 | 39.783333333333 | | Weekly Target 4 | 40.78 | | Weekly Target 5 | 41.56 |
Weekly price and volumes for Western Midstream
| Date |
Closing |
Open |
Range |
Volume |
Fri 05 December 2025 |
39.99 (1.68%) |
39.10 |
38.79 - 40.57 |
1.1709 times |
Fri 28 November 2025 |
39.33 (0.95%) |
39.21 |
38.68 - 39.73 |
0.6325 times |
Fri 21 November 2025 |
38.96 (0.7%) |
38.74 |
38.60 - 39.39 |
0.755 times |
Fri 14 November 2025 |
38.69 (-0.77%) |
39.21 |
38.44 - 39.74 |
1.3452 times |
Fri 07 November 2025 |
38.99 (4.06%) |
37.21 |
37.01 - 39.45 |
0.8597 times |
Fri 31 October 2025 |
37.47 (0%) |
37.53 |
37.22 - 37.71 |
0.1822 times |
Fri 31 October 2025 |
37.47 (-2.27%) |
38.63 |
37.22 - 38.92 |
0.8421 times |
Fri 24 October 2025 |
38.34 (1.59%) |
37.92 |
37.44 - 39.10 |
1.4906 times |
Fri 17 October 2025 |
37.74 (1.29%) |
37.60 |
37.13 - 38.12 |
1.4184 times |
Fri 10 October 2025 |
37.26 (-5.38%) |
38.53 |
37.24 - 39.40 |
1.3033 times |
Fri 03 October 2025 |
39.38 (-0.1%) |
39.65 |
38.25 - 39.97 |
1.2553 times |
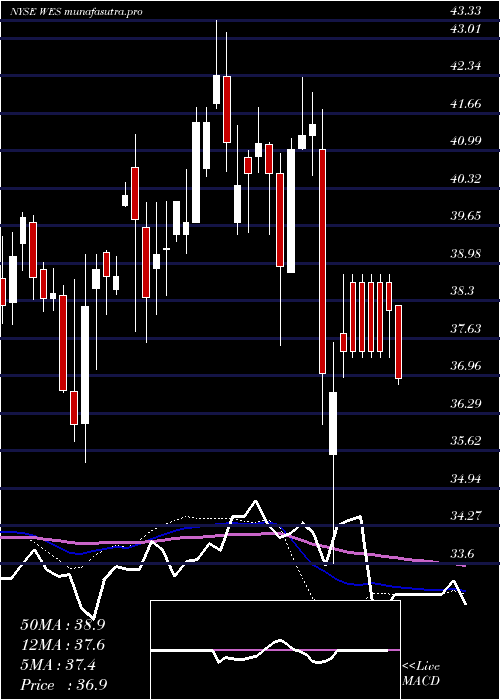
Monthly price and charts WesternMidstream Strong monthly Stock price targets for WesternMidstream WES are 39.39 and 41.17 | Monthly Target 1 | 38 | | Monthly Target 2 | 39 | | Monthly Target 3 | 39.783333333333 | | Monthly Target 4 | 40.78 | | Monthly Target 5 | 41.56 |
Monthly price and volumes Western Midstream
| Date |
Closing |
Open |
Range |
Volume |
Fri 05 December 2025 |
39.99 (1.68%) |
39.10 |
38.79 - 40.57 |
0.3607 times |
Fri 28 November 2025 |
39.33 (4.96%) |
37.21 |
37.01 - 39.74 |
1.1067 times |
Fri 31 October 2025 |
37.47 (-4.63%) |
39.26 |
37.13 - 39.97 |
1.8155 times |
Tue 30 September 2025 |
39.29 (0.2%) |
39.19 |
37.78 - 39.95 |
1.0829 times |
Fri 29 August 2025 |
39.21 (-3.73%) |
39.60 |
37.50 - 40.68 |
1.235 times |
Thu 31 July 2025 |
40.73 (5.25%) |
38.83 |
38.11 - 41.39 |
0.7663 times |
Mon 30 June 2025 |
38.70 (3.48%) |
37.62 |
37.20 - 39.26 |
0.733 times |
Fri 30 May 2025 |
37.40 (-0.53%) |
37.60 |
35.25 - 40.00 |
0.9325 times |
Wed 30 April 2025 |
37.60 (-8.2%) |
41.12 |
33.60 - 41.74 |
0.9492 times |
Mon 31 March 2025 |
40.96 (0.94%) |
40.59 |
37.51 - 42.30 |
1.0182 times |
Fri 28 February 2025 |
40.58 (-1.39%) |
39.71 |
39.50 - 41.78 |
0.9586 times |

DMA SMA EMA moving averages of Western Midstream WES
DMA (daily moving average) of Western Midstream WES
| DMA period | DMA value | | 5 day DMA | 39.53 | | 12 day DMA | 39.23 | | 20 day DMA | 39.14 | | 35 day DMA | 38.72 | | 50 day DMA | 38.63 | | 100 day DMA | 38.79 | | 150 day DMA | 38.66 | | 200 day DMA | 38.76 | EMA (exponential moving average) of Western Midstream WES
| EMA period | EMA current | EMA prev | EMA prev2 | | 5 day EMA | 39.66 | 39.5 | 39.1 | | 12 day EMA | 39.34 | 39.22 | 39.02 | | 20 day EMA | 39.12 | 39.03 | 38.9 | | 35 day EMA | 38.95 | 38.89 | 38.81 | | 50 day EMA | 38.74 | 38.69 | 38.62 |
SMA (simple moving average) of Western Midstream WES
| SMA period | SMA current | SMA prev | SMA prev2 | | 5 day SMA | 39.53 | 39.4 | 39.14 | | 12 day SMA | 39.23 | 39.15 | 39.04 | | 20 day SMA | 39.14 | 39.07 | 38.96 | | 35 day SMA | 38.72 | 38.65 | 38.58 | | 50 day SMA | 38.63 | 38.62 | 38.6 | | 100 day SMA | 38.79 | 38.79 | 38.79 | | 150 day SMA | 38.66 | 38.64 | 38.62 | | 200 day SMA | 38.76 | 38.76 | 38.77 |
|
|
