WasteConnections WCN full analysis,charts,indicators,moving averages,SMA,DMA,EMA,ADX,MACD,RSIWaste Connections WCN WideScreen charts, DMA,SMA,EMA technical analysis, forecast prediction, by indicators ADX,MACD,RSI,CCI NYSE stock exchange
operates under Public Utilities sector & deals in Environmental Services
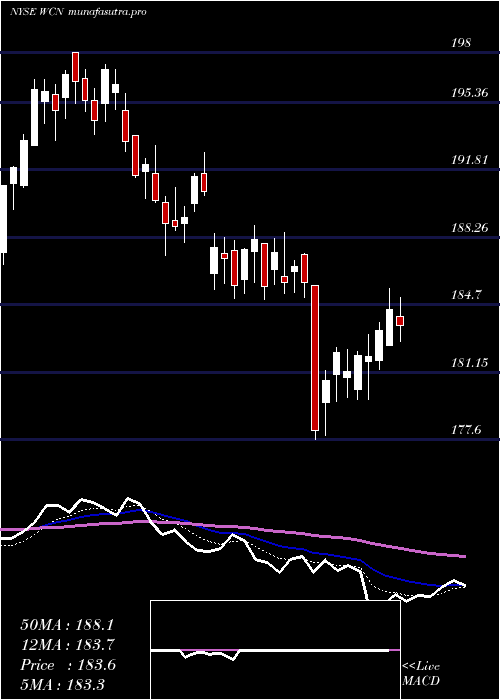
Daily price and charts and targets WasteConnections Strong Daily Stock price targets for WasteConnections WCN are 172.32 and 173.97 | Daily Target 1 | 172 | | Daily Target 2 | 172.63 | | Daily Target 3 | 173.65333333333 | | Daily Target 4 | 174.28 | | Daily Target 5 | 175.3 |
Daily price and volume Waste Connections
| Date |
Closing |
Open |
Range |
Volume |
Thu 04 December 2025 |
173.25 (-0.58%) |
174.14 |
173.03 - 174.68 |
1.0368 times |
Wed 03 December 2025 |
174.26 (0.57%) |
173.90 |
173.04 - 174.58 |
0.9373 times |
Tue 02 December 2025 |
173.28 (-0.51%) |
174.23 |
172.86 - 174.83 |
0.7386 times |
Mon 01 December 2025 |
174.16 (-1.35%) |
176.50 |
174.09 - 177.23 |
0.9646 times |
Fri 28 November 2025 |
176.55 (-0.27%) |
177.27 |
176.25 - 178.09 |
0.5622 times |
Wed 26 November 2025 |
177.03 (0.3%) |
176.93 |
176.17 - 177.67 |
0.5451 times |
Tue 25 November 2025 |
176.50 (1.93%) |
173.13 |
173.13 - 177.29 |
0.8985 times |
Mon 24 November 2025 |
173.15 (-1.23%) |
175.37 |
172.79 - 175.37 |
1.6566 times |
Fri 21 November 2025 |
175.30 (1.03%) |
173.00 |
171.52 - 176.00 |
1.3256 times |
Thu 20 November 2025 |
173.52 (-0.66%) |
174.19 |
173.08 - 175.86 |
1.3348 times |
Wed 19 November 2025 |
174.68 (1.46%) |
172.44 |
171.34 - 174.99 |
1.431 times |
Weekly price and charts WasteConnections Strong weekly Stock price targets for WasteConnections WCN are 170.87 and 175.24 | Weekly Target 1 | 170.08 | | Weekly Target 2 | 171.66 | | Weekly Target 3 | 174.44666666667 | | Weekly Target 4 | 176.03 | | Weekly Target 5 | 178.82 |
Weekly price and volumes for Waste Connections
| Date |
Closing |
Open |
Range |
Volume |
Thu 04 December 2025 |
173.25 (-1.87%) |
176.50 |
172.86 - 177.23 |
0.6125 times |
Fri 28 November 2025 |
176.55 (0.71%) |
175.37 |
172.79 - 178.09 |
0.6101 times |
Fri 21 November 2025 |
175.30 (3.96%) |
169.09 |
167.82 - 176.00 |
1.1182 times |
Fri 14 November 2025 |
168.63 (1.47%) |
165.02 |
163.27 - 170.35 |
1.1217 times |
Fri 07 November 2025 |
166.18 (-0.89%) |
166.32 |
164.66 - 168.82 |
1.2473 times |
Fri 31 October 2025 |
167.68 (0%) |
169.55 |
167.47 - 170.25 |
0.3769 times |
Fri 31 October 2025 |
167.68 (-5.17%) |
176.22 |
167.47 - 177.05 |
1.4743 times |
Fri 24 October 2025 |
176.82 (2.23%) |
172.75 |
172.26 - 179.74 |
1.3857 times |
Fri 17 October 2025 |
172.97 (0.07%) |
171.53 |
169.40 - 173.95 |
1.0995 times |
Fri 10 October 2025 |
172.85 (-0.9%) |
173.70 |
169.87 - 175.57 |
0.9537 times |
Fri 03 October 2025 |
174.42 (1.17%) |
172.09 |
171.82 - 176.65 |
0.8823 times |
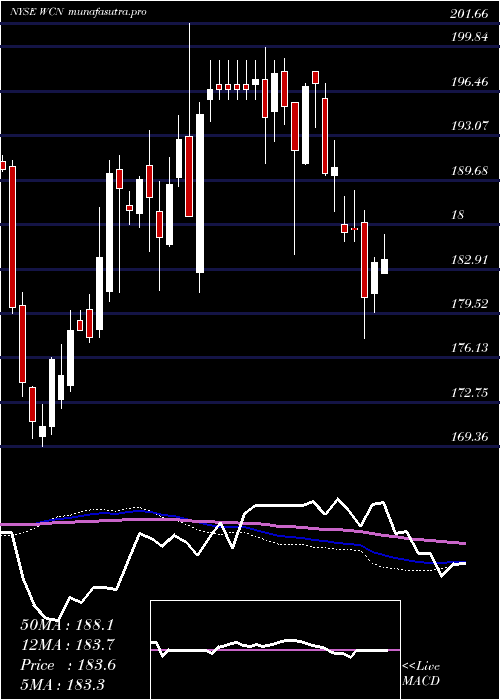
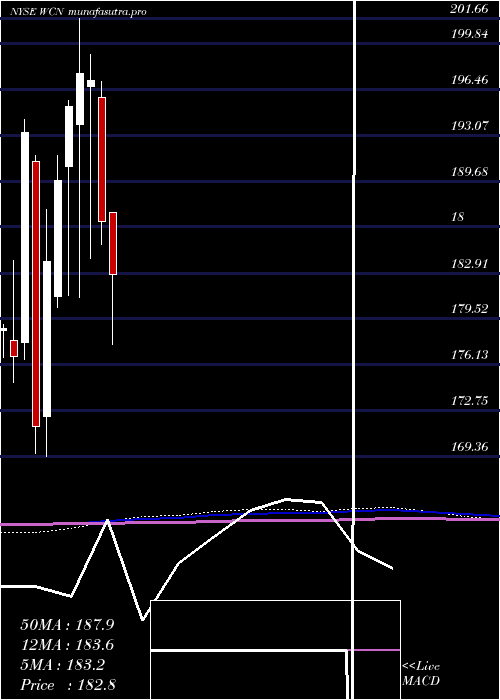
Monthly price and charts WasteConnections Strong monthly Stock price targets for WasteConnections WCN are 170.87 and 175.24 | Monthly Target 1 | 170.08 | | Monthly Target 2 | 171.66 | | Monthly Target 3 | 174.44666666667 | | Monthly Target 4 | 176.03 | | Monthly Target 5 | 178.82 |
Monthly price and volumes Waste Connections
| Date |
Closing |
Open |
Range |
Volume |
Thu 04 December 2025 |
173.25 (-1.87%) |
176.50 |
172.86 - 177.23 |
0.1368 times |
Fri 28 November 2025 |
176.55 (5.29%) |
166.32 |
163.27 - 178.09 |
0.9151 times |
Fri 31 October 2025 |
167.68 (-4.62%) |
175.55 |
167.47 - 179.74 |
1.2831 times |
Tue 30 September 2025 |
175.80 (-4.88%) |
184.12 |
170.64 - 185.12 |
1.1943 times |
Fri 29 August 2025 |
184.81 (-1%) |
188.19 |
181.33 - 191.00 |
0.9179 times |
Thu 31 July 2025 |
186.67 (-0.03%) |
187.36 |
177.60 - 191.91 |
1.484 times |
Mon 30 June 2025 |
186.72 (-5.26%) |
195.88 |
185.00 - 197.07 |
0.744 times |
Fri 30 May 2025 |
197.09 (-0.27%) |
196.67 |
184.00 - 199.00 |
1.0874 times |
Wed 30 April 2025 |
197.63 (1.25%) |
193.88 |
181.12 - 201.66 |
1.3571 times |
Mon 31 March 2025 |
195.19 (2.86%) |
190.78 |
181.28 - 195.64 |
0.8803 times |
Fri 28 February 2025 |
189.76 (3.26%) |
181.20 |
180.40 - 191.57 |
0.8921 times |
DMA SMA EMA moving averages of Waste Connections WCN
DMA (daily moving average) of Waste Connections WCN
| DMA period | DMA value | | 5 day DMA | 174.3 | | 12 day DMA | 174.49 | | 20 day DMA | 171.64 | | 35 day DMA | 171.85 | | 50 day DMA | 172.2 | | 100 day DMA | 177.37 | | 150 day DMA | 181.58 | | 200 day DMA | 184.09 | EMA (exponential moving average) of Waste Connections WCN
| EMA period | EMA current | EMA prev | EMA prev2 | | 5 day EMA | 174.04 | 174.44 | 174.53 | | 12 day EMA | 173.61 | 173.68 | 173.58 | | 20 day EMA | 172.93 | 172.9 | 172.76 | | 35 day EMA | 172.66 | 172.62 | 172.52 | | 50 day EMA | 172.48 | 172.45 | 172.38 |
SMA (simple moving average) of Waste Connections WCN
| SMA period | SMA current | SMA prev | SMA prev2 | | 5 day SMA | 174.3 | 175.06 | 175.5 | | 12 day SMA | 174.49 | 174.16 | 173.69 | | 20 day SMA | 171.64 | 171.28 | 171 | | 35 day SMA | 171.85 | 171.75 | 171.7 | | 50 day SMA | 172.2 | 172.18 | 172.13 | | 100 day SMA | 177.37 | 177.47 | 177.58 | | 150 day SMA | 181.58 | 181.74 | 181.89 | | 200 day SMA | 184.09 | 184.16 | 184.23 |
|
|
