WescoInternational WCC full analysis,charts,indicators,moving averages,SMA,DMA,EMA,ADX,MACD,RSIWesco International WCC WideScreen charts, DMA,SMA,EMA technical analysis, forecast prediction, by indicators ADX,MACD,RSI,CCI NYSE stock exchange
operates under Consumer Non Durables sector & deals in Telecommunications Equipment
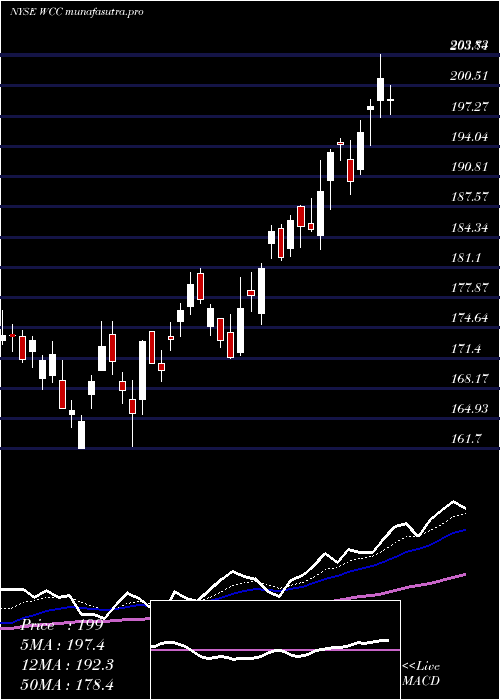
Daily price and charts and targets WescoInternational Strong Daily Stock price targets for WescoInternational WCC are 270.51 and 274.14 | Daily Target 1 | 267.83 | | Daily Target 2 | 269.56 | | Daily Target 3 | 271.45666666667 | | Daily Target 4 | 273.19 | | Daily Target 5 | 275.09 |
Daily price and volume Wesco International
| Date |
Closing |
Open |
Range |
Volume |
Thu 04 December 2025 |
271.30 (0.27%) |
270.45 |
269.72 - 273.35 |
0.7284 times |
Wed 03 December 2025 |
270.57 (1.59%) |
266.64 |
263.37 - 272.00 |
0.762 times |
Tue 02 December 2025 |
266.33 (0.09%) |
267.15 |
263.95 - 269.00 |
0.8608 times |
Mon 01 December 2025 |
266.08 (-0.5%) |
263.92 |
263.08 - 270.28 |
1.1257 times |
Fri 28 November 2025 |
267.41 (1.07%) |
266.21 |
263.51 - 268.48 |
0.6048 times |
Wed 26 November 2025 |
264.58 (1.71%) |
261.83 |
260.06 - 267.27 |
0.9701 times |
Tue 25 November 2025 |
260.13 (2.2%) |
255.09 |
251.75 - 261.04 |
1.0703 times |
Mon 24 November 2025 |
254.53 (1.17%) |
251.40 |
243.00 - 255.94 |
0.8813 times |
Fri 21 November 2025 |
251.59 (1.87%) |
247.25 |
240.55 - 253.32 |
1.6152 times |
Thu 20 November 2025 |
246.98 (-2.13%) |
255.81 |
245.72 - 261.37 |
1.3815 times |
Wed 19 November 2025 |
252.36 (1.34%) |
251.97 |
250.23 - 258.95 |
1.5086 times |
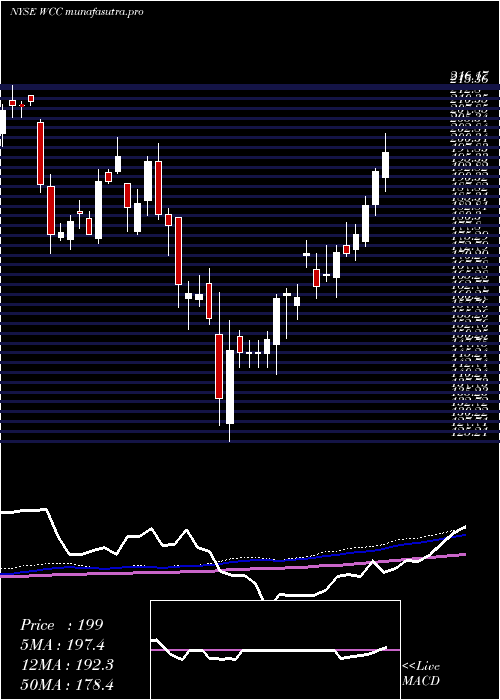
Weekly price and charts WescoInternational Strong weekly Stock price targets for WescoInternational WCC are 267.19 and 277.46 | Weekly Target 1 | 258.97 | | Weekly Target 2 | 265.14 | | Weekly Target 3 | 269.24333333333 | | Weekly Target 4 | 275.41 | | Weekly Target 5 | 279.51 |
Weekly price and volumes for Wesco International
| Date |
Closing |
Open |
Range |
Volume |
Thu 04 December 2025 |
271.30 (1.45%) |
263.92 |
263.08 - 273.35 |
0.5969 times |
Fri 28 November 2025 |
267.41 (6.29%) |
251.40 |
243.00 - 268.48 |
0.6054 times |
Fri 21 November 2025 |
251.59 (-2.01%) |
259.01 |
240.55 - 261.37 |
1.3484 times |
Fri 14 November 2025 |
256.75 (0.52%) |
258.30 |
250.84 - 268.27 |
1.2645 times |
Fri 07 November 2025 |
255.43 (-1.58%) |
256.15 |
250.44 - 261.69 |
0.7773 times |
Fri 31 October 2025 |
259.53 (0%) |
249.85 |
248.89 - 263.37 |
0.4598 times |
Fri 31 October 2025 |
259.53 (15.07%) |
228.02 |
219.62 - 263.37 |
2.2952 times |
Fri 24 October 2025 |
225.54 (5.5%) |
216.91 |
213.48 - 226.31 |
0.7396 times |
Fri 17 October 2025 |
213.78 (2.64%) |
212.09 |
207.39 - 223.42 |
0.9894 times |
Fri 10 October 2025 |
208.29 (-3.51%) |
217.58 |
208.16 - 226.93 |
0.9235 times |
Fri 03 October 2025 |
215.87 (0.98%) |
215.05 |
208.69 - 218.47 |
0.8478 times |
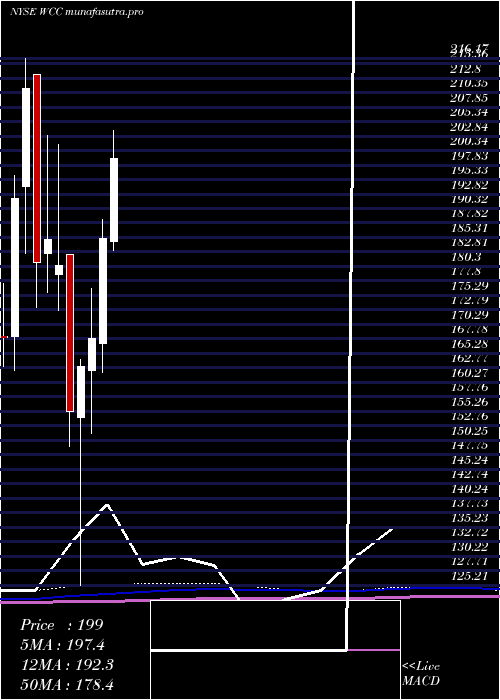
Monthly price and charts WescoInternational Strong monthly Stock price targets for WescoInternational WCC are 267.19 and 277.46 | Monthly Target 1 | 258.97 | | Monthly Target 2 | 265.14 | | Monthly Target 3 | 269.24333333333 | | Monthly Target 4 | 275.41 | | Monthly Target 5 | 279.51 |
Monthly price and volumes Wesco International
| Date |
Closing |
Open |
Range |
Volume |
Thu 04 December 2025 |
271.30 (1.45%) |
263.92 |
263.08 - 273.35 |
0.1199 times |
Fri 28 November 2025 |
267.41 (3.04%) |
256.15 |
240.55 - 268.48 |
0.8025 times |
Fri 31 October 2025 |
259.53 (22.71%) |
210.30 |
207.39 - 263.37 |
1.1724 times |
Tue 30 September 2025 |
211.50 (-3.79%) |
215.88 |
203.40 - 224.01 |
1.1121 times |
Fri 29 August 2025 |
219.84 (6.22%) |
200.99 |
197.96 - 228.35 |
0.88 times |
Thu 31 July 2025 |
206.96 (11.75%) |
184.56 |
183.00 - 219.07 |
1.2526 times |
Mon 30 June 2025 |
185.20 (10.31%) |
167.00 |
161.98 - 188.48 |
0.8942 times |
Fri 30 May 2025 |
167.89 (3.03%) |
162.24 |
151.45 - 176.54 |
1.0947 times |
Wed 30 April 2025 |
162.96 (4.93%) |
154.27 |
125.21 - 164.22 |
1.3909 times |
Mon 31 March 2025 |
155.30 (-13.95%) |
182.37 |
149.16 - 182.37 |
1.2807 times |
Fri 28 February 2025 |
180.47 (-2.45%) |
178.89 |
172.76 - 201.39 |
1.189 times |
DMA SMA EMA moving averages of Wesco International WCC
DMA (daily moving average) of Wesco International WCC
| DMA period | DMA value | | 5 day DMA | 268.34 | | 12 day DMA | 260.07 | | 20 day DMA | 259.1 | | 35 day DMA | 247.55 | | 50 day DMA | 237.83 | | 100 day DMA | 225.39 | | 150 day DMA | 209.12 | | 200 day DMA | 197.02 | EMA (exponential moving average) of Wesco International WCC
| EMA period | EMA current | EMA prev | EMA prev2 | | 5 day EMA | 267.89 | 266.19 | 264 | | 12 day EMA | 262.74 | 261.19 | 259.48 | | 20 day EMA | 257.85 | 256.43 | 254.94 | | 35 day EMA | 248.14 | 246.78 | 245.38 | | 50 day EMA | 238.65 | 237.32 | 235.96 |
SMA (simple moving average) of Wesco International WCC
| SMA period | SMA current | SMA prev | SMA prev2 | | 5 day SMA | 268.34 | 266.99 | 264.91 | | 12 day SMA | 260.07 | 258.12 | 256.97 | | 20 day SMA | 259.1 | 258.37 | 257.44 | | 35 day SMA | 247.55 | 246.05 | 244.58 | | 50 day SMA | 237.83 | 236.56 | 235.35 | | 100 day SMA | 225.39 | 224.66 | 223.93 | | 150 day SMA | 209.12 | 208.4 | 207.68 | | 200 day SMA | 197.02 | 196.66 | 196.29 |
|
|
