WestinghouseAir WAB full analysis,charts,indicators,moving averages,SMA,DMA,EMA,ADX,MACD,RSIWestinghouse Air WAB WideScreen charts, DMA,SMA,EMA technical analysis, forecast prediction, by indicators ADX,MACD,RSI,CCI NYSE stock exchange
operates under Capital Goods sector & deals in Railroads
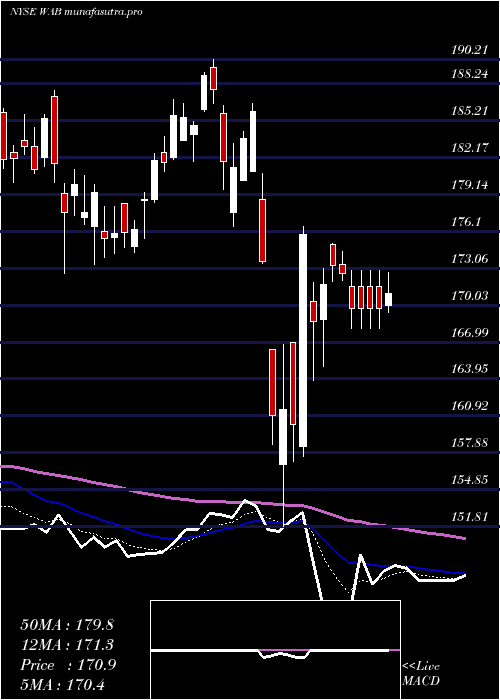
Daily price and charts and targets WestinghouseAir Strong Daily Stock price targets for WestinghouseAir WAB are 213.98 and 216.04 | Daily Target 1 | 212.28 | | Daily Target 2 | 213.62 | | Daily Target 3 | 214.34333333333 | | Daily Target 4 | 215.68 | | Daily Target 5 | 216.4 |
Daily price and volume Westinghouse Air
| Date |
Closing |
Open |
Range |
Volume |
Fri 05 December 2025 |
214.95 (0.43%) |
213.65 |
213.01 - 215.07 |
0.6545 times |
Thu 04 December 2025 |
214.04 (0.28%) |
212.91 |
211.20 - 215.23 |
0.7373 times |
Wed 03 December 2025 |
213.45 (2.43%) |
208.73 |
207.74 - 214.05 |
1.1455 times |
Tue 02 December 2025 |
208.38 (-0.13%) |
208.32 |
206.76 - 209.16 |
0.9754 times |
Mon 01 December 2025 |
208.65 (0.05%) |
207.22 |
206.75 - 210.87 |
1.2292 times |
Fri 28 November 2025 |
208.55 (0.39%) |
208.43 |
207.76 - 209.63 |
0.456 times |
Wed 26 November 2025 |
207.75 (0.81%) |
205.63 |
205.02 - 208.24 |
0.8514 times |
Tue 25 November 2025 |
206.08 (3.03%) |
200.92 |
199.82 - 206.38 |
0.949 times |
Mon 24 November 2025 |
200.01 (-0.1%) |
201.72 |
199.85 - 203.43 |
1.5908 times |
Fri 21 November 2025 |
200.22 (2.08%) |
196.01 |
194.93 - 202.03 |
1.4108 times |
Thu 20 November 2025 |
196.14 (-0.9%) |
201.84 |
195.77 - 201.96 |
0.6647 times |
Weekly price and charts WestinghouseAir Strong weekly Stock price targets for WestinghouseAir WAB are 210.85 and 219.33 | Weekly Target 1 | 203.83 | | Weekly Target 2 | 209.39 | | Weekly Target 3 | 212.31 | | Weekly Target 4 | 217.87 | | Weekly Target 5 | 220.79 |
Weekly price and volumes for Westinghouse Air
| Date |
Closing |
Open |
Range |
Volume |
Fri 05 December 2025 |
214.95 (3.07%) |
207.22 |
206.75 - 215.23 |
0.9904 times |
Fri 28 November 2025 |
208.55 (4.16%) |
201.72 |
199.82 - 209.63 |
0.8035 times |
Fri 21 November 2025 |
200.22 (-1.81%) |
203.61 |
194.93 - 204.18 |
1.2239 times |
Fri 14 November 2025 |
203.92 (-1.16%) |
206.31 |
199.96 - 211.43 |
1.2352 times |
Fri 07 November 2025 |
206.31 (0.91%) |
202.23 |
201.03 - 207.83 |
0.988 times |
Fri 31 October 2025 |
204.44 (0%) |
202.06 |
202.06 - 206.22 |
0.2748 times |
Fri 31 October 2025 |
204.44 (3.45%) |
198.29 |
196.91 - 206.22 |
1.3157 times |
Fri 24 October 2025 |
197.63 (1.79%) |
195.94 |
186.06 - 199.26 |
1.2685 times |
Fri 17 October 2025 |
194.15 (1.63%) |
194.22 |
191.28 - 199.26 |
0.9136 times |
Fri 10 October 2025 |
191.03 (-4.52%) |
201.06 |
190.82 - 202.89 |
0.9863 times |
Fri 03 October 2025 |
200.08 (1.73%) |
197.60 |
196.31 - 201.89 |
1.2939 times |
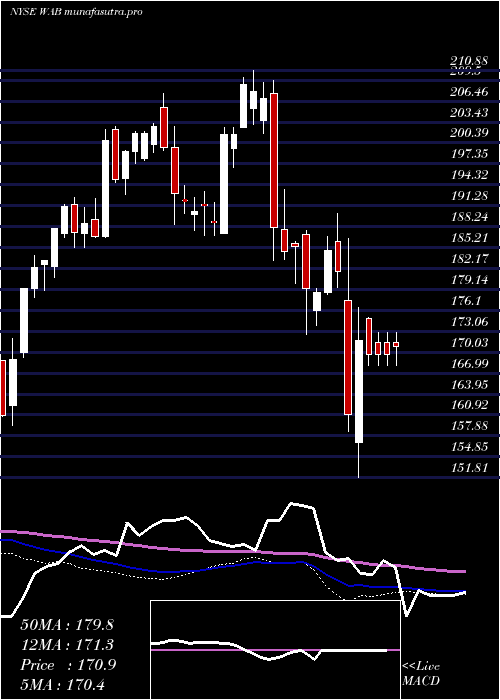
Monthly price and charts WestinghouseAir Strong monthly Stock price targets for WestinghouseAir WAB are 210.85 and 219.33 | Monthly Target 1 | 203.83 | | Monthly Target 2 | 209.39 | | Monthly Target 3 | 212.31 | | Monthly Target 4 | 217.87 | | Monthly Target 5 | 220.79 |
Monthly price and volumes Westinghouse Air
| Date |
Closing |
Open |
Range |
Volume |
Fri 05 December 2025 |
214.95 (3.07%) |
207.22 |
206.75 - 215.23 |
0.1977 times |
Fri 28 November 2025 |
208.55 (2.01%) |
202.23 |
194.93 - 211.43 |
0.8483 times |
Fri 31 October 2025 |
204.44 (1.98%) |
199.04 |
186.06 - 206.22 |
1.0881 times |
Tue 30 September 2025 |
200.47 (3.6%) |
190.51 |
184.26 - 201.94 |
1.253 times |
Fri 29 August 2025 |
193.50 (0.76%) |
188.52 |
185.64 - 197.82 |
1.1311 times |
Thu 31 July 2025 |
192.05 (-8.26%) |
208.28 |
188.99 - 216.10 |
1.4058 times |
Mon 30 June 2025 |
209.35 (3.47%) |
202.07 |
197.85 - 210.27 |
0.8936 times |
Fri 30 May 2025 |
202.32 (9.52%) |
185.00 |
183.98 - 207.70 |
0.9292 times |
Wed 30 April 2025 |
184.74 (1.87%) |
180.26 |
151.81 - 186.54 |
1.0533 times |
Mon 31 March 2025 |
181.35 (-2.16%) |
187.10 |
172.58 - 190.21 |
1.1999 times |
Fri 28 February 2025 |
185.36 (-10.85%) |
203.72 |
180.05 - 209.39 |
1.462 times |

DMA SMA EMA moving averages of Westinghouse Air WAB
DMA (daily moving average) of Westinghouse Air WAB
| DMA period | DMA value | | 5 day DMA | 211.89 | | 12 day DMA | 206.35 | | 20 day DMA | 205.77 | | 35 day DMA | 203.37 | | 50 day DMA | 201.49 | | 100 day DMA | 197.8 | | 150 day DMA | 199.85 | | 200 day DMA | 194.46 | EMA (exponential moving average) of Westinghouse Air WAB
| EMA period | EMA current | EMA prev | EMA prev2 | | 5 day EMA | 212.2 | 210.83 | 209.22 | | 12 day EMA | 208.63 | 207.48 | 206.29 | | 20 day EMA | 206.54 | 205.66 | 204.78 | | 35 day EMA | 203.89 | 203.24 | 202.6 | | 50 day EMA | 201.9 | 201.37 | 200.85 |
SMA (simple moving average) of Westinghouse Air WAB
| SMA period | SMA current | SMA prev | SMA prev2 | | 5 day SMA | 211.89 | 210.61 | 209.36 | | 12 day SMA | 206.35 | 204.9 | 203.7 | | 20 day SMA | 205.77 | 205.21 | 204.81 | | 35 day SMA | 203.37 | 202.76 | 202.27 | | 50 day SMA | 201.49 | 201.08 | 200.65 | | 100 day SMA | 197.8 | 197.76 | 197.73 | | 150 day SMA | 199.85 | 199.67 | 199.47 | | 200 day SMA | 194.46 | 194.35 | 194.22 |
|
|
