BristowGroup VTOL full analysis,charts,indicators,moving averages,SMA,DMA,EMA,ADX,MACD,RSIBristow Group VTOL WideScreen charts, DMA,SMA,EMA technical analysis, forecast prediction, by indicators ADX,MACD,RSI,CCI NYSE stock exchange
Daily price and charts and targets BristowGroup Strong Daily Stock price targets for BristowGroup VTOL are 35.96 and 37.21 | Daily Target 1 | 35.73 | | Daily Target 2 | 36.19 | | Daily Target 3 | 36.983333333333 | | Daily Target 4 | 37.44 | | Daily Target 5 | 38.23 |
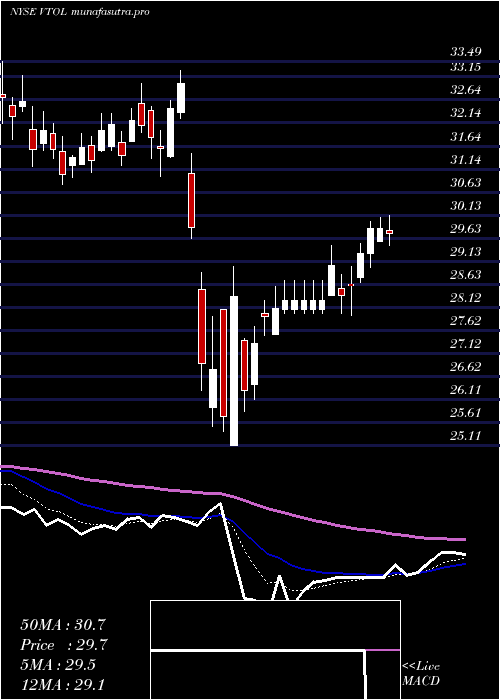
Daily price and volume Bristow Group
| Date |
Closing |
Open |
Range |
Volume |
Fri 05 December 2025 |
36.64 (-1.87%) |
37.46 |
36.53 - 37.78 |
0.8382 times |
Thu 04 December 2025 |
37.34 (-0.13%) |
37.14 |
37.05 - 37.91 |
0.8486 times |
Wed 03 December 2025 |
37.39 (3.37%) |
36.51 |
36.27 - 37.70 |
0.8498 times |
Tue 02 December 2025 |
36.17 (-2.79%) |
37.22 |
35.96 - 37.22 |
0.9249 times |
Mon 01 December 2025 |
37.21 (-0.8%) |
37.34 |
37.13 - 38.01 |
1.0254 times |
Fri 28 November 2025 |
37.51 (0.51%) |
37.44 |
37.25 - 37.87 |
0.491 times |
Wed 26 November 2025 |
37.32 (-0.48%) |
37.37 |
37.28 - 38.24 |
1.7839 times |
Tue 25 November 2025 |
37.50 (1.96%) |
37.17 |
36.39 - 37.67 |
1.1941 times |
Mon 24 November 2025 |
36.78 (-0.22%) |
36.63 |
36.39 - 36.98 |
0.7256 times |
Fri 21 November 2025 |
36.86 (0.52%) |
36.56 |
36.13 - 37.18 |
1.3183 times |
Thu 20 November 2025 |
36.67 (-1.03%) |
37.42 |
36.62 - 38.28 |
1.2421 times |
Weekly price and charts BristowGroup Strong weekly Stock price targets for BristowGroup VTOL are 35.28 and 37.33 | Weekly Target 1 | 34.82 | | Weekly Target 2 | 35.73 | | Weekly Target 3 | 36.87 | | Weekly Target 4 | 37.78 | | Weekly Target 5 | 38.92 |
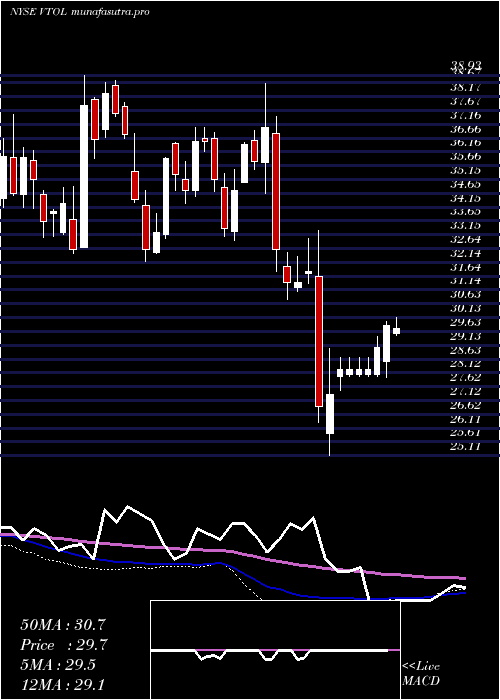
Weekly price and volumes for Bristow Group
| Date |
Closing |
Open |
Range |
Volume |
Fri 05 December 2025 |
36.64 (-2.32%) |
37.34 |
35.96 - 38.01 |
0.8959 times |
Fri 28 November 2025 |
37.51 (1.76%) |
36.63 |
36.39 - 38.24 |
0.8376 times |
Fri 21 November 2025 |
36.86 (-5.1%) |
38.53 |
36.13 - 39.18 |
1.1278 times |
Fri 14 November 2025 |
38.84 (5%) |
37.47 |
36.80 - 39.22 |
1.4184 times |
Fri 07 November 2025 |
36.99 (-9.12%) |
42.15 |
35.03 - 42.15 |
1.3698 times |
Fri 31 October 2025 |
40.70 (0%) |
39.91 |
39.63 - 40.90 |
0.5345 times |
Fri 31 October 2025 |
40.70 (2.73%) |
39.61 |
38.05 - 40.90 |
1.0702 times |
Fri 24 October 2025 |
39.62 (3.72%) |
38.20 |
38.17 - 42.06 |
0.9814 times |
Fri 17 October 2025 |
38.20 (3.69%) |
37.46 |
37.08 - 39.32 |
0.8956 times |
Fri 10 October 2025 |
36.84 (0.71%) |
36.74 |
35.86 - 38.04 |
0.8688 times |
Fri 03 October 2025 |
36.58 (-3.41%) |
37.69 |
35.38 - 37.74 |
0.6792 times |
Monthly price and charts BristowGroup Strong monthly Stock price targets for BristowGroup VTOL are 35.28 and 37.33 | Monthly Target 1 | 34.82 | | Monthly Target 2 | 35.73 | | Monthly Target 3 | 36.87 | | Monthly Target 4 | 37.78 | | Monthly Target 5 | 38.92 |
Monthly price and volumes Bristow Group
| Date |
Closing |
Open |
Range |
Volume |
Fri 05 December 2025 |
36.64 (-2.32%) |
37.34 |
35.96 - 38.01 |
0.2298 times |
Fri 28 November 2025 |
37.51 (-7.84%) |
42.15 |
35.03 - 42.15 |
1.2192 times |
Fri 31 October 2025 |
40.70 (12.8%) |
35.76 |
35.75 - 42.06 |
1.213 times |
Tue 30 September 2025 |
36.08 (-6.31%) |
38.01 |
35.38 - 38.62 |
0.9188 times |
Fri 29 August 2025 |
38.51 (11.4%) |
34.03 |
32.76 - 39.32 |
1.1602 times |
Thu 31 July 2025 |
34.57 (4.85%) |
32.99 |
32.43 - 37.14 |
0.9369 times |
Mon 30 June 2025 |
32.97 (12.68%) |
29.49 |
29.26 - 35.34 |
1.4214 times |
Fri 30 May 2025 |
29.26 (0.76%) |
28.81 |
26.53 - 31.02 |
1.1639 times |
Wed 30 April 2025 |
29.04 (-8.04%) |
31.41 |
25.11 - 33.28 |
0.9671 times |
Mon 31 March 2025 |
31.58 (-14.74%) |
36.81 |
30.80 - 37.45 |
0.7697 times |
Fri 28 February 2025 |
37.04 (11%) |
33.25 |
32.93 - 38.64 |
0.7149 times |

DMA SMA EMA moving averages of Bristow Group VTOL
DMA (daily moving average) of Bristow Group VTOL
| DMA period | DMA value | | 5 day DMA | 36.95 | | 12 day DMA | 37.04 | | 20 day DMA | 37.34 | | 35 day DMA | 38.24 | | 50 day DMA | 37.93 | | 100 day DMA | 37.57 | | 150 day DMA | 35.61 | | 200 day DMA | 34.42 | EMA (exponential moving average) of Bristow Group VTOL
| EMA period | EMA current | EMA prev | EMA prev2 | | 5 day EMA | 36.99 | 37.16 | 37.07 | | 12 day EMA | 37.18 | 37.28 | 37.27 | | 20 day EMA | 37.43 | 37.51 | 37.53 | | 35 day EMA | 37.54 | 37.59 | 37.6 | | 50 day EMA | 37.75 | 37.8 | 37.82 |
SMA (simple moving average) of Bristow Group VTOL
| SMA period | SMA current | SMA prev | SMA prev2 | | 5 day SMA | 36.95 | 37.12 | 37.12 | | 12 day SMA | 37.04 | 37.09 | 37.07 | | 20 day SMA | 37.34 | 37.4 | 37.47 | | 35 day SMA | 38.24 | 38.3 | 38.34 | | 50 day SMA | 37.93 | 37.94 | 37.94 | | 100 day SMA | 37.57 | 37.55 | 37.53 | | 150 day SMA | 35.61 | 35.56 | 35.51 | | 200 day SMA | 34.42 | 34.42 | 34.42 |
|
|
