VornadoRealty VNO full analysis,charts,indicators,moving averages,SMA,DMA,EMA,ADX,MACD,RSIVornado Realty VNO WideScreen charts, DMA,SMA,EMA technical analysis, forecast prediction, by indicators ADX,MACD,RSI,CCI NYSE stock exchange
operates under Consumer Services sector & deals in Real Estate Investment Trusts
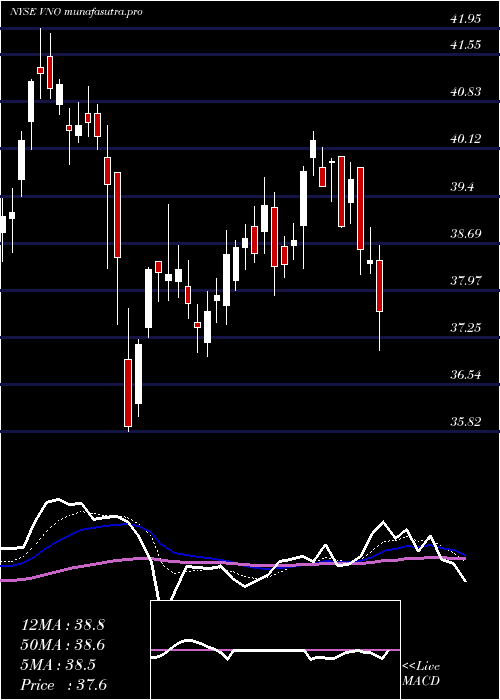
Daily price and charts and targets VornadoRealty Strong Daily Stock price targets for VornadoRealty VNO are 38.72 and 39.89 | Daily Target 1 | 37.79 | | Daily Target 2 | 38.47 | | Daily Target 3 | 38.96 | | Daily Target 4 | 39.64 | | Daily Target 5 | 40.13 |
Daily price and volume Vornado Realty
| Date |
Closing |
Open |
Range |
Volume |
Tue 21 October 2025 |
39.15 (2.27%) |
38.37 |
38.28 - 39.45 |
0.6968 times |
Mon 20 October 2025 |
38.28 (-2.4%) |
39.47 |
38.16 - 39.78 |
0.8146 times |
Fri 17 October 2025 |
39.22 (-0.71%) |
39.29 |
38.79 - 39.61 |
1.3123 times |
Thu 16 October 2025 |
39.50 (-2.13%) |
40.63 |
39.10 - 40.90 |
1.79 times |
Wed 15 October 2025 |
40.36 (1.43%) |
40.18 |
39.70 - 41.00 |
1.0183 times |
Tue 14 October 2025 |
39.79 (2.24%) |
38.78 |
38.60 - 39.94 |
0.7986 times |
Mon 13 October 2025 |
38.92 (-4.02%) |
38.41 |
38.25 - 39.00 |
0.7865 times |
Tue 07 October 2025 |
40.55 (-1.67%) |
41.26 |
40.52 - 41.61 |
0.8694 times |
Mon 06 October 2025 |
41.24 (0.54%) |
41.13 |
40.86 - 41.85 |
0.9743 times |
Fri 03 October 2025 |
41.02 (-0.1%) |
41.07 |
40.85 - 41.67 |
0.9393 times |
Thu 02 October 2025 |
41.06 (-0.39%) |
41.27 |
40.85 - 41.59 |
0.6903 times |
Weekly price and charts VornadoRealty Strong weekly Stock price targets for VornadoRealty VNO are 37.85 and 39.47 | Weekly Target 1 | 37.41 | | Weekly Target 2 | 38.28 | | Weekly Target 3 | 39.03 | | Weekly Target 4 | 39.9 | | Weekly Target 5 | 40.65 |
Weekly price and volumes for Vornado Realty
| Date |
Closing |
Open |
Range |
Volume |
Tue 21 October 2025 |
39.15 (-0.18%) |
39.47 |
38.16 - 39.78 |
0.254 times |
Fri 17 October 2025 |
39.22 (-3.28%) |
38.41 |
38.25 - 41.00 |
0.9589 times |
Tue 07 October 2025 |
40.55 (-1.15%) |
41.13 |
40.52 - 41.85 |
0.3099 times |
Fri 03 October 2025 |
41.02 (1.86%) |
40.50 |
39.93 - 41.67 |
0.7481 times |
Fri 26 September 2025 |
40.27 (-3.41%) |
41.18 |
39.73 - 42.17 |
0.9435 times |
Fri 19 September 2025 |
41.69 (-2.98%) |
42.90 |
41.06 - 43.37 |
2.1955 times |
Fri 12 September 2025 |
42.97 (4.07%) |
40.31 |
39.67 - 43.23 |
1.1685 times |
Fri 05 September 2025 |
41.29 (8.57%) |
37.30 |
37.23 - 41.37 |
1.5927 times |
Fri 29 August 2025 |
38.03 (0%) |
37.63 |
37.57 - 38.24 |
0.2298 times |
Fri 29 August 2025 |
38.03 (-0.13%) |
37.88 |
36.92 - 38.24 |
1.5992 times |
Fri 22 August 2025 |
38.08 (2.34%) |
36.92 |
36.01 - 38.18 |
1.5413 times |

Monthly price and charts VornadoRealty Strong monthly Stock price targets for VornadoRealty VNO are 36.81 and 40.5 | Monthly Target 1 | 36.03 | | Monthly Target 2 | 37.59 | | Monthly Target 3 | 39.72 | | Monthly Target 4 | 41.28 | | Monthly Target 5 | 43.41 |
Monthly price and volumes Vornado Realty
| Date |
Closing |
Open |
Range |
Volume |
Tue 21 October 2025 |
39.15 (-3.4%) |
40.50 |
38.16 - 41.85 |
0.4322 times |
Tue 30 September 2025 |
40.53 (6.57%) |
37.30 |
37.23 - 43.37 |
1.3798 times |
Fri 29 August 2025 |
38.03 (-1.02%) |
38.42 |
35.22 - 39.05 |
1.2518 times |
Thu 31 July 2025 |
38.42 (0.47%) |
38.11 |
36.95 - 40.38 |
1.1664 times |
Mon 30 June 2025 |
38.24 (1.51%) |
37.15 |
35.82 - 41.95 |
1.1919 times |
Fri 30 May 2025 |
37.67 (6.77%) |
35.45 |
35.00 - 40.73 |
0.8465 times |
Wed 30 April 2025 |
35.28 (-4.62%) |
37.22 |
29.68 - 38.20 |
1.001 times |
Mon 31 March 2025 |
36.99 (-12.01%) |
41.88 |
34.91 - 42.43 |
0.9672 times |
Fri 28 February 2025 |
42.04 (-2.82%) |
41.63 |
38.48 - 45.37 |
0.8694 times |
Fri 31 January 2025 |
43.26 (2.9%) |
42.00 |
37.28 - 44.32 |
0.8939 times |
Tue 31 December 2024 |
42.04 (-4.43%) |
43.40 |
40.03 - 46.52 |
0.7832 times |

DMA SMA EMA moving averages of Vornado Realty VNO
DMA (daily moving average) of Vornado Realty VNO
| DMA period | DMA value | | 5 day DMA | 39.3 | | 12 day DMA | 40.03 | | 20 day DMA | 40.4 | | 35 day DMA | 40.45 | | 50 day DMA | 39.45 | | 100 day DMA | 39.12 | | 150 day DMA | 38.24 | | 200 day DMA | 38.87 | EMA (exponential moving average) of Vornado Realty VNO
| EMA period | EMA current | EMA prev | EMA prev2 | | 5 day EMA | 39.2 | 39.23 | 39.71 | | 12 day EMA | 39.74 | 39.85 | 40.14 | | 20 day EMA | 39.99 | 40.08 | 40.27 | | 35 day EMA | 39.67 | 39.7 | 39.78 | | 50 day EMA | 39.29 | 39.3 | 39.34 |
SMA (simple moving average) of Vornado Realty VNO
| SMA period | SMA current | SMA prev | SMA prev2 | | 5 day SMA | 39.3 | 39.43 | 39.56 | | 12 day SMA | 40.03 | 40.14 | 40.32 | | 20 day SMA | 40.4 | 40.53 | 40.68 | | 35 day SMA | 40.45 | 40.41 | 40.39 | | 50 day SMA | 39.45 | 39.42 | 39.41 | | 100 day SMA | 39.12 | 39.1 | 39.09 | | 150 day SMA | 38.24 | 38.21 | 38.2 | | 200 day SMA | 38.87 | 38.88 | 38.9 |
|
|
