ViciProperties VICI full analysis,charts,indicators,moving averages,SMA,DMA,EMA,ADX,MACD,RSIVici Properties VICI WideScreen charts, DMA,SMA,EMA technical analysis, forecast prediction, by indicators ADX,MACD,RSI,CCI NYSE stock exchange
operates under Consumer Services sector & deals in Real Estate Investment Trusts
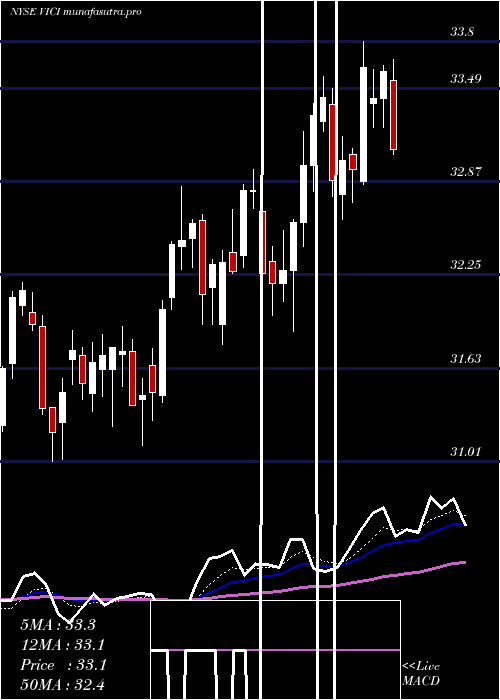
Daily price and charts and targets ViciProperties Strong Daily Stock price targets for ViciProperties VICI are 27.72 and 28.22 | Daily Target 1 | 27.63 | | Daily Target 2 | 27.81 | | Daily Target 3 | 28.126666666667 | | Daily Target 4 | 28.31 | | Daily Target 5 | 28.63 |
Daily price and volume Vici Properties
| Date |
Closing |
Open |
Range |
Volume |
Thu 04 December 2025 |
28.00 (-1.06%) |
28.34 |
27.94 - 28.44 |
0.6157 times |
Wed 03 December 2025 |
28.30 (-0.49%) |
28.40 |
28.12 - 28.64 |
1.004 times |
Tue 02 December 2025 |
28.44 (-0.52%) |
28.62 |
28.18 - 28.70 |
0.7669 times |
Mon 01 December 2025 |
28.59 (-0.8%) |
28.63 |
28.38 - 28.63 |
1.2183 times |
Fri 28 November 2025 |
28.82 (-0.03%) |
28.83 |
28.79 - 28.98 |
0.4941 times |
Wed 26 November 2025 |
28.83 (0.28%) |
28.80 |
28.73 - 29.08 |
0.9034 times |
Tue 25 November 2025 |
28.75 (0.07%) |
28.80 |
28.62 - 28.97 |
0.9452 times |
Mon 24 November 2025 |
28.73 (-0.31%) |
28.85 |
28.58 - 29.00 |
0.7345 times |
Fri 21 November 2025 |
28.82 (0.07%) |
28.91 |
28.71 - 29.08 |
1.9062 times |
Thu 20 November 2025 |
28.80 (-1.2%) |
29.29 |
28.75 - 29.41 |
1.4116 times |
Wed 19 November 2025 |
29.15 (-1.39%) |
29.50 |
29.12 - 29.56 |
0.7631 times |
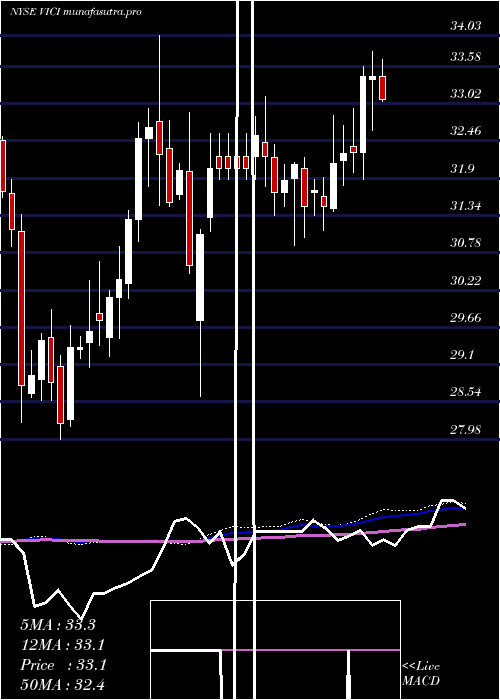
Weekly price and charts ViciProperties Strong weekly Stock price targets for ViciProperties VICI are 27.59 and 28.35 | Weekly Target 1 | 27.45 | | Weekly Target 2 | 27.73 | | Weekly Target 3 | 28.213333333333 | | Weekly Target 4 | 28.49 | | Weekly Target 5 | 28.97 |
Weekly price and volumes for Vici Properties
| Date |
Closing |
Open |
Range |
Volume |
Thu 04 December 2025 |
28.00 (-2.85%) |
28.63 |
27.94 - 28.70 |
1.0627 times |
Fri 28 November 2025 |
28.82 (0%) |
28.85 |
28.58 - 29.08 |
0.9071 times |
Fri 21 November 2025 |
28.82 (-5.07%) |
30.36 |
28.71 - 30.40 |
1.622 times |
Fri 14 November 2025 |
30.36 (0.07%) |
30.23 |
30.07 - 30.83 |
0.9918 times |
Fri 07 November 2025 |
30.34 (1.17%) |
30.27 |
29.76 - 30.48 |
0.8816 times |
Fri 31 October 2025 |
29.99 (0%) |
29.29 |
28.96 - 30.22 |
0.2942 times |
Fri 31 October 2025 |
29.99 (-3.85%) |
31.12 |
28.96 - 31.18 |
1.5528 times |
Fri 24 October 2025 |
31.19 (0.52%) |
30.85 |
30.77 - 31.69 |
0.9427 times |
Fri 17 October 2025 |
31.03 (0.23%) |
30.85 |
30.50 - 31.48 |
0.7496 times |
Fri 10 October 2025 |
30.96 (-5.12%) |
32.64 |
30.75 - 32.64 |
0.9955 times |
Fri 03 October 2025 |
32.63 (0.49%) |
32.50 |
32.21 - 33.01 |
0.9601 times |
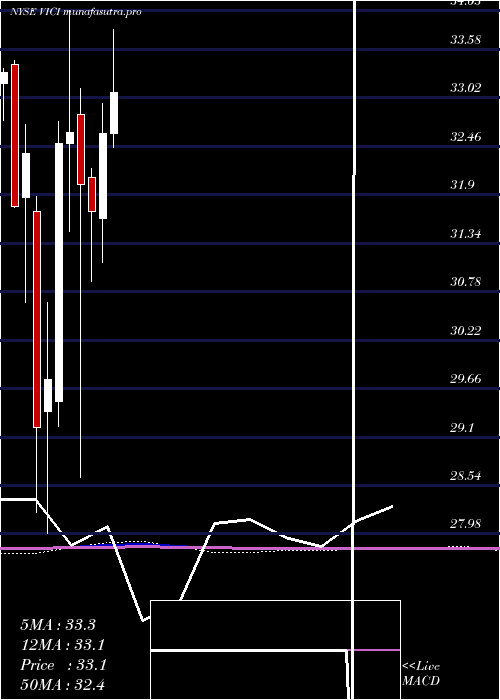
Monthly price and charts ViciProperties Strong monthly Stock price targets for ViciProperties VICI are 27.59 and 28.35 | Monthly Target 1 | 27.45 | | Monthly Target 2 | 27.73 | | Monthly Target 3 | 28.213333333333 | | Monthly Target 4 | 28.49 | | Monthly Target 5 | 28.97 |
Monthly price and volumes Vici Properties
| Date |
Closing |
Open |
Range |
Volume |
Thu 04 December 2025 |
28.00 (-2.85%) |
28.63 |
27.94 - 28.70 |
0.297 times |
Fri 28 November 2025 |
28.82 (-3.9%) |
30.27 |
28.58 - 30.83 |
1.2304 times |
Fri 31 October 2025 |
29.99 (-8.03%) |
32.73 |
28.96 - 33.01 |
1.3739 times |
Tue 30 September 2025 |
32.61 (-3.46%) |
33.52 |
31.41 - 33.83 |
1.2882 times |
Fri 29 August 2025 |
33.78 (3.62%) |
32.96 |
32.19 - 34.01 |
1.1337 times |
Thu 31 July 2025 |
32.60 (0%) |
32.60 |
32.42 - 33.80 |
0.8679 times |
Mon 30 June 2025 |
32.60 (2.81%) |
31.62 |
31.12 - 32.95 |
0.7637 times |
Fri 30 May 2025 |
31.71 (-0.97%) |
32.10 |
30.89 - 32.20 |
0.8171 times |
Wed 30 April 2025 |
32.02 (-1.84%) |
32.83 |
28.63 - 33.12 |
1.1172 times |
Mon 31 March 2025 |
32.62 (0.4%) |
32.49 |
31.48 - 34.03 |
1.1111 times |
Fri 28 February 2025 |
32.49 (9.14%) |
29.51 |
29.22 - 32.74 |
0.7784 times |
DMA SMA EMA moving averages of Vici Properties VICI
DMA (daily moving average) of Vici Properties VICI
| DMA period | DMA value | | 5 day DMA | 28.43 | | 12 day DMA | 28.73 | | 20 day DMA | 29.37 | | 35 day DMA | 29.9 | | 50 day DMA | 30.51 | | 100 day DMA | 31.74 | | 150 day DMA | 31.88 | | 200 day DMA | 31.9 | EMA (exponential moving average) of Vici Properties VICI
| EMA period | EMA current | EMA prev | EMA prev2 | | 5 day EMA | 28.37 | 28.55 | 28.67 | | 12 day EMA | 28.8 | 28.94 | 29.06 | | 20 day EMA | 29.19 | 29.32 | 29.43 | | 35 day EMA | 29.83 | 29.94 | 30.04 | | 50 day EMA | 30.4 | 30.5 | 30.59 |
SMA (simple moving average) of Vici Properties VICI
| SMA period | SMA current | SMA prev | SMA prev2 | | 5 day SMA | 28.43 | 28.6 | 28.69 | | 12 day SMA | 28.73 | 28.91 | 29.08 | | 20 day SMA | 29.37 | 29.48 | 29.58 | | 35 day SMA | 29.9 | 30 | 30.08 | | 50 day SMA | 30.51 | 30.59 | 30.66 | | 100 day SMA | 31.74 | 31.79 | 31.84 | | 150 day SMA | 31.88 | 31.9 | 31.93 | | 200 day SMA | 31.9 | 31.91 | 31.92 |
|
|
