ValsparCorp VAL full analysis,charts,indicators,moving averages,SMA,DMA,EMA,ADX,MACD,RSIValspar Corp VAL WideScreen charts, DMA,SMA,EMA technical analysis, forecast prediction, by indicators ADX,MACD,RSI,CCI NYSE stock exchange
Daily price and charts and targets ValsparCorp Strong Daily Stock price targets for ValsparCorp VAL are 58.92 and 60.82 | Daily Target 1 | 58.58 | | Daily Target 2 | 59.25 | | Daily Target 3 | 60.476666666667 | | Daily Target 4 | 61.15 | | Daily Target 5 | 62.38 |
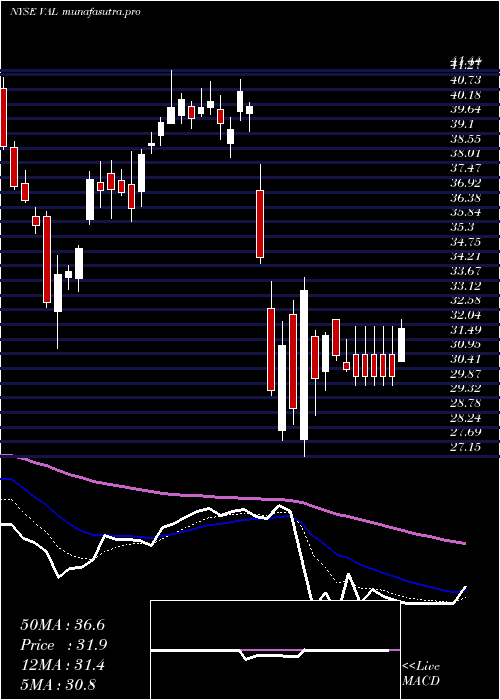
Daily price and volume Valspar Corp
| Date |
Closing |
Open |
Range |
Volume |
Fri 05 December 2025 |
59.93 (0.55%) |
60.00 |
59.80 - 61.70 |
1.1458 times |
Thu 04 December 2025 |
59.60 (-1.36%) |
60.00 |
58.85 - 60.61 |
1.1651 times |
Wed 03 December 2025 |
60.42 (6.17%) |
57.67 |
57.08 - 61.21 |
1.6004 times |
Tue 02 December 2025 |
56.91 (-1.18%) |
57.74 |
55.90 - 57.75 |
0.774 times |
Mon 01 December 2025 |
57.59 (2.09%) |
56.23 |
56.00 - 57.73 |
0.9166 times |
Fri 28 November 2025 |
56.41 (0.84%) |
56.52 |
55.57 - 57.40 |
0.4611 times |
Wed 26 November 2025 |
55.94 (-0.12%) |
55.50 |
55.46 - 56.62 |
0.5848 times |
Tue 25 November 2025 |
56.01 (2%) |
54.99 |
53.29 - 56.15 |
1.327 times |
Mon 24 November 2025 |
54.91 (1.38%) |
53.99 |
53.37 - 55.43 |
0.9616 times |
Fri 21 November 2025 |
54.16 (0.97%) |
53.01 |
51.50 - 54.48 |
1.0635 times |
Thu 20 November 2025 |
53.64 (-3.39%) |
56.03 |
53.26 - 57.06 |
1.0712 times |
Weekly price and charts ValsparCorp Strong weekly Stock price targets for ValsparCorp VAL are 57.92 and 63.72 | Weekly Target 1 | 53.38 | | Weekly Target 2 | 56.65 | | Weekly Target 3 | 59.176666666667 | | Weekly Target 4 | 62.45 | | Weekly Target 5 | 64.98 |
Weekly price and volumes for Valspar Corp
| Date |
Closing |
Open |
Range |
Volume |
Fri 05 December 2025 |
59.93 (6.24%) |
56.23 |
55.90 - 61.70 |
1.1849 times |
Fri 28 November 2025 |
56.41 (4.15%) |
53.99 |
53.29 - 57.40 |
0.7053 times |
Fri 21 November 2025 |
54.16 (-5.03%) |
57.20 |
51.50 - 58.21 |
0.9062 times |
Fri 14 November 2025 |
57.03 (4.82%) |
55.33 |
54.45 - 58.85 |
0.9349 times |
Fri 07 November 2025 |
54.41 (-3.05%) |
55.05 |
52.60 - 56.18 |
0.7932 times |
Fri 31 October 2025 |
56.12 (0%) |
57.97 |
55.13 - 57.97 |
0.2887 times |
Fri 31 October 2025 |
56.12 (-0.99%) |
57.00 |
55.13 - 58.39 |
1.4856 times |
Fri 24 October 2025 |
56.68 (17.28%) |
48.39 |
48.14 - 58.14 |
1.5211 times |
Fri 17 October 2025 |
48.33 (3.38%) |
48.00 |
47.25 - 50.58 |
1.1467 times |
Fri 10 October 2025 |
46.75 (-10.22%) |
52.09 |
46.70 - 52.80 |
1.0333 times |
Fri 03 October 2025 |
52.07 (3.31%) |
50.30 |
47.76 - 52.88 |
1.174 times |

Monthly price and charts ValsparCorp Strong monthly Stock price targets for ValsparCorp VAL are 57.92 and 63.72 | Monthly Target 1 | 53.38 | | Monthly Target 2 | 56.65 | | Monthly Target 3 | 59.176666666667 | | Monthly Target 4 | 62.45 | | Monthly Target 5 | 64.98 |
Monthly price and volumes Valspar Corp
| Date |
Closing |
Open |
Range |
Volume |
Fri 05 December 2025 |
59.93 (6.24%) |
56.23 |
55.90 - 61.70 |
0.1897 times |
Fri 28 November 2025 |
56.41 (0.52%) |
55.05 |
51.50 - 58.85 |
0.5346 times |
Fri 31 October 2025 |
56.12 (15.07%) |
48.53 |
46.70 - 58.39 |
0.9894 times |
Tue 30 September 2025 |
48.77 (-1.81%) |
48.77 |
47.76 - 53.98 |
0.8926 times |
Fri 29 August 2025 |
49.67 (2.14%) |
47.02 |
43.53 - 50.12 |
0.8879 times |
Thu 31 July 2025 |
48.63 (15.48%) |
42.50 |
41.88 - 51.86 |
1.087 times |
Mon 30 June 2025 |
42.11 (11.94%) |
38.66 |
37.79 - 47.36 |
1.1007 times |
Fri 30 May 2025 |
37.62 (16.43%) |
33.38 |
32.43 - 41.40 |
1.2744 times |
Wed 30 April 2025 |
32.31 (-17.7%) |
39.91 |
27.15 - 41.09 |
1.6463 times |
Mon 31 March 2025 |
39.26 (9.97%) |
36.02 |
31.15 - 41.44 |
1.3974 times |
Fri 28 February 2025 |
35.70 (-25.53%) |
47.51 |
35.40 - 48.43 |
1.4165 times |

DMA SMA EMA moving averages of Valspar Corp VAL
DMA (daily moving average) of Valspar Corp VAL
| DMA period | DMA value | | 5 day DMA | 58.89 | | 12 day DMA | 56.75 | | 20 day DMA | 56.62 | | 35 day DMA | 55.49 | | 50 day DMA | 53.86 | | 100 day DMA | 51.49 | | 150 day DMA | 48.26 | | 200 day DMA | 44.96 | EMA (exponential moving average) of Valspar Corp VAL
| EMA period | EMA current | EMA prev | EMA prev2 | | 5 day EMA | 58.93 | 58.43 | 57.85 | | 12 day EMA | 57.59 | 57.17 | 56.73 | | 20 day EMA | 56.76 | 56.43 | 56.1 | | 35 day EMA | 55.32 | 55.05 | 54.78 | | 50 day EMA | 54.09 | 53.85 | 53.62 |
SMA (simple moving average) of Valspar Corp VAL
| SMA period | SMA current | SMA prev | SMA prev2 | | 5 day SMA | 58.89 | 58.19 | 57.45 | | 12 day SMA | 56.75 | 56.49 | 56.2 | | 20 day SMA | 56.62 | 56.33 | 56.01 | | 35 day SMA | 55.49 | 55.15 | 54.88 | | 50 day SMA | 53.86 | 53.67 | 53.49 | | 100 day SMA | 51.49 | 51.35 | 51.22 | | 150 day SMA | 48.26 | 48.1 | 47.92 | | 200 day SMA | 44.96 | 44.88 | 44.8 |
|
|
