UnitedStates UZD full analysis,charts,indicators,moving averages,SMA,DMA,EMA,ADX,MACD,RSIUnited States UZD WideScreen charts, DMA,SMA,EMA technical analysis, forecast prediction, by indicators ADX,MACD,RSI,CCI NYSE stock exchange
Daily price and charts and targets UnitedStates Strong Daily Stock price targets for UnitedStates UZD are 21.51 and 22.04 | Daily Target 1 | 21.09 | | Daily Target 2 | 21.4 | | Daily Target 3 | 21.623333333333 | | Daily Target 4 | 21.93 | | Daily Target 5 | 22.15 |
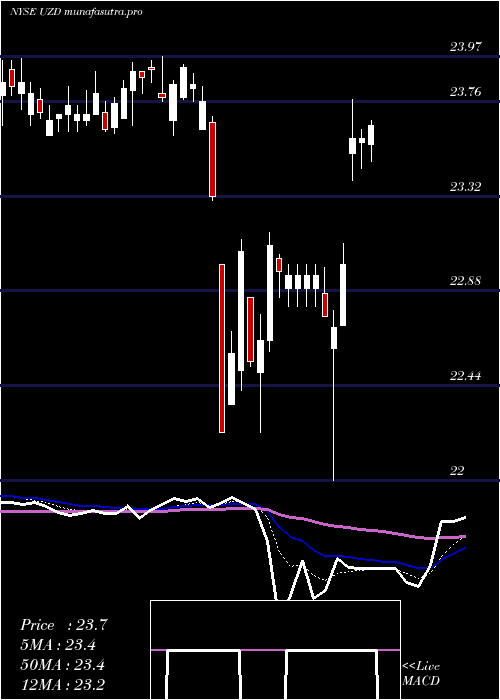
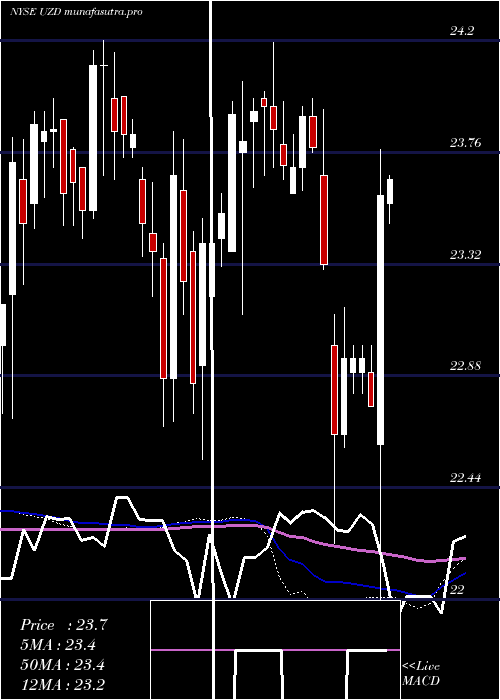
Daily price and volume United States
| Date |
Closing |
Open |
Range |
Volume |
Mon 20 October 2025 |
21.70 (2.07%) |
21.48 |
21.32 - 21.85 |
0.5536 times |
Fri 17 October 2025 |
21.26 (-0.05%) |
21.30 |
20.95 - 21.30 |
0.3691 times |
Thu 16 October 2025 |
21.27 (-0.09%) |
21.19 |
21.06 - 21.37 |
0.7733 times |
Wed 15 October 2025 |
21.29 (0.28%) |
21.19 |
21.19 - 21.45 |
0.2109 times |
Tue 14 October 2025 |
21.23 (-0.28%) |
21.04 |
21.04 - 21.25 |
0.3691 times |
Mon 13 October 2025 |
21.29 (0.71%) |
21.24 |
21.24 - 21.45 |
0.1054 times |
Fri 10 October 2025 |
21.14 (-0.19%) |
21.10 |
21.05 - 21.48 |
1.1511 times |
Thu 09 October 2025 |
21.18 (-0.05%) |
21.17 |
21.11 - 21.23 |
2.1705 times |
Wed 08 October 2025 |
21.19 (0.09%) |
21.10 |
21.04 - 21.23 |
1.8102 times |
Tue 07 October 2025 |
21.17 (-0.47%) |
21.32 |
20.70 - 21.32 |
2.4868 times |
Mon 06 October 2025 |
21.27 (-0.7%) |
21.39 |
21.20 - 21.39 |
3.2572 times |
Weekly price and charts UnitedStates Strong weekly Stock price targets for UnitedStates UZD are 21.51 and 22.04 | Weekly Target 1 | 21.09 | | Weekly Target 2 | 21.4 | | Weekly Target 3 | 21.623333333333 | | Weekly Target 4 | 21.93 | | Weekly Target 5 | 22.15 |
Weekly price and volumes for United States
| Date |
Closing |
Open |
Range |
Volume |
Mon 20 October 2025 |
21.70 (2.07%) |
21.48 |
21.32 - 21.85 |
0.0122 times |
Fri 17 October 2025 |
21.26 (0.57%) |
21.24 |
20.95 - 21.45 |
0.0402 times |
Fri 10 October 2025 |
21.14 (-1.31%) |
21.39 |
20.70 - 21.48 |
0.2393 times |
Fri 03 October 2025 |
21.42 (0.05%) |
21.39 |
20.95 - 21.99 |
1.7022 times |
Fri 26 September 2025 |
21.41 (-2.68%) |
21.93 |
20.95 - 21.98 |
0.3369 times |
Fri 19 September 2025 |
22.00 (-1.83%) |
22.50 |
21.82 - 22.50 |
0.1087 times |
Fri 12 September 2025 |
22.41 (1.45%) |
22.00 |
21.93 - 22.67 |
0.1901 times |
Fri 05 September 2025 |
22.09 (6.61%) |
21.02 |
20.83 - 22.11 |
0.1903 times |
Fri 29 August 2025 |
20.72 (0%) |
20.54 |
20.31 - 22.54 |
3.0776 times |
Fri 29 August 2025 |
20.72 (5.28%) |
19.69 |
19.62 - 22.54 |
4.1025 times |
Fri 22 August 2025 |
19.68 (0.82%) |
19.50 |
19.13 - 20.20 |
0.5664 times |
Monthly price and charts UnitedStates Strong monthly Stock price targets for UnitedStates UZD are 21.2 and 22.35 | Monthly Target 1 | 20.27 | | Monthly Target 2 | 20.98 | | Monthly Target 3 | 21.416666666667 | | Monthly Target 4 | 22.13 | | Monthly Target 5 | 22.57 |
Monthly price and volumes United States
| Date |
Closing |
Open |
Range |
Volume |
Mon 20 October 2025 |
21.70 (2.26%) |
21.30 |
20.70 - 21.85 |
0.1911 times |
Tue 30 September 2025 |
21.22 (2.41%) |
21.02 |
20.83 - 22.67 |
0.8991 times |
Fri 29 August 2025 |
20.72 (-18.9%) |
25.66 |
19.13 - 25.72 |
3.3687 times |
Thu 31 July 2025 |
25.55 (8.13%) |
23.62 |
22.95 - 25.70 |
0.4088 times |
Mon 30 June 2025 |
23.63 (-2.27%) |
24.11 |
23.44 - 24.17 |
0.9593 times |
Fri 30 May 2025 |
24.18 (2.46%) |
23.54 |
23.43 - 24.37 |
0.8979 times |
Wed 30 April 2025 |
23.60 (-1.01%) |
23.78 |
22.00 - 23.93 |
0.553 times |
Mon 31 March 2025 |
23.84 (-0.04%) |
23.79 |
23.60 - 23.97 |
0.793 times |
Fri 28 February 2025 |
23.85 (-0.25%) |
23.76 |
23.12 - 24.19 |
1.1224 times |
Fri 31 January 2025 |
23.91 (3.42%) |
23.18 |
22.55 - 23.96 |
0.8066 times |
Tue 31 December 2024 |
23.12 (-2.98%) |
23.84 |
22.68 - 23.84 |
0.7162 times |

DMA SMA EMA moving averages of United States UZD
DMA (daily moving average) of United States UZD
| DMA period | DMA value | | 5 day DMA | 21.35 | | 12 day DMA | 21.28 | | 20 day DMA | 21.33 | | 35 day DMA | 21.67 | | 50 day DMA | 21.2 | | 100 day DMA | 22.64 | | 150 day DMA | 22.93 | | 200 day DMA | 23.12 | EMA (exponential moving average) of United States UZD
| EMA period | EMA current | EMA prev | EMA prev2 | | 5 day EMA | 21.41 | 21.26 | 21.26 | | 12 day EMA | 21.35 | 21.29 | 21.3 | | 20 day EMA | 21.4 | 21.37 | 21.38 | | 35 day EMA | 21.36 | 21.34 | 21.35 | | 50 day EMA | 21.39 | 21.38 | 21.39 |
SMA (simple moving average) of United States UZD
| SMA period | SMA current | SMA prev | SMA prev2 | | 5 day SMA | 21.35 | 21.27 | 21.24 | | 12 day SMA | 21.28 | 21.27 | 21.28 | | 20 day SMA | 21.33 | 21.34 | 21.38 | | 35 day SMA | 21.67 | 21.64 | 21.62 | | 50 day SMA | 21.2 | 21.18 | 21.2 | | 100 day SMA | 22.64 | 22.66 | 22.69 | | 150 day SMA | 22.93 | 22.94 | 22.96 | | 200 day SMA | 23.12 | 23.12 | 23.13 |
|
|
