UniversalTechnical UTI full analysis,charts,indicators,moving averages,SMA,DMA,EMA,ADX,MACD,RSIUniversal Technical UTI WideScreen charts, DMA,SMA,EMA technical analysis, forecast prediction, by indicators ADX,MACD,RSI,CCI NYSE stock exchange
operates under Consumer Services sector & deals in Other Consumer Services
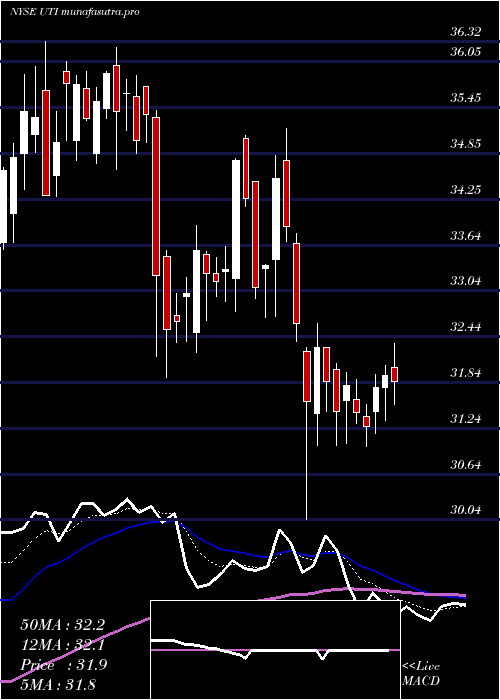
Daily price and charts and targets UniversalTechnical Strong Daily Stock price targets for UniversalTechnical UTI are 31 and 32.11 | Daily Target 1 | 30.1 | | Daily Target 2 | 30.78 | | Daily Target 3 | 31.213333333333 | | Daily Target 4 | 31.89 | | Daily Target 5 | 32.32 |
Daily price and volume Universal Technical
| Date |
Closing |
Open |
Range |
Volume |
Mon 20 October 2025 |
31.45 (2.28%) |
31.11 |
30.54 - 31.65 |
0.8652 times |
Fri 17 October 2025 |
30.75 (0.72%) |
30.43 |
30.00 - 31.23 |
1.3643 times |
Thu 16 October 2025 |
30.53 (-4.29%) |
32.00 |
30.47 - 32.00 |
1.4057 times |
Wed 15 October 2025 |
31.90 (0.82%) |
31.68 |
31.33 - 32.06 |
0.9812 times |
Tue 14 October 2025 |
31.64 (4.25%) |
30.09 |
29.92 - 31.69 |
0.8387 times |
Mon 13 October 2025 |
30.35 (1.57%) |
30.10 |
29.87 - 30.43 |
0.6313 times |
Fri 10 October 2025 |
29.88 (-1.35%) |
30.34 |
29.80 - 30.69 |
0.6647 times |
Thu 09 October 2025 |
30.29 (-0.59%) |
30.19 |
30.08 - 30.49 |
0.7774 times |
Wed 08 October 2025 |
30.47 (1.57%) |
30.14 |
30.14 - 30.71 |
0.6723 times |
Tue 07 October 2025 |
30.00 (-5.69%) |
31.61 |
29.40 - 31.65 |
1.7992 times |
Mon 06 October 2025 |
31.81 (0.13%) |
31.49 |
31.20 - 32.17 |
1.1396 times |
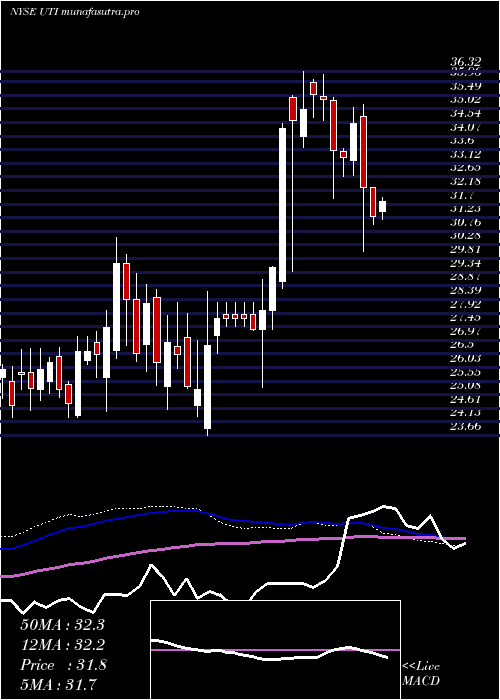
Weekly price and charts UniversalTechnical Strong weekly Stock price targets for UniversalTechnical UTI are 31 and 32.11 | Weekly Target 1 | 30.1 | | Weekly Target 2 | 30.78 | | Weekly Target 3 | 31.213333333333 | | Weekly Target 4 | 31.89 | | Weekly Target 5 | 32.32 |
Weekly price and volumes for Universal Technical
| Date |
Closing |
Open |
Range |
Volume |
Mon 20 October 2025 |
31.45 (2.28%) |
31.11 |
30.54 - 31.65 |
0.1786 times |
Fri 17 October 2025 |
30.75 (2.91%) |
30.10 |
29.87 - 32.06 |
1.0781 times |
Fri 10 October 2025 |
29.88 (-5.95%) |
31.49 |
29.40 - 32.17 |
1.0434 times |
Fri 03 October 2025 |
31.77 (-0.25%) |
32.64 |
30.99 - 33.17 |
1.3286 times |
Fri 26 September 2025 |
31.85 (12.58%) |
28.26 |
28.19 - 31.96 |
1.6711 times |
Fri 19 September 2025 |
28.29 (4.05%) |
27.29 |
26.82 - 29.01 |
1.5059 times |
Fri 12 September 2025 |
27.19 (0.97%) |
26.97 |
26.83 - 28.36 |
1.0085 times |
Fri 05 September 2025 |
26.93 (1.28%) |
26.30 |
26.30 - 27.77 |
0.8805 times |
Fri 29 August 2025 |
26.59 (0%) |
26.98 |
26.48 - 27.18 |
0.2022 times |
Fri 29 August 2025 |
26.59 (-0.86%) |
26.80 |
26.20 - 27.45 |
1.103 times |
Fri 22 August 2025 |
26.82 (3.03%) |
25.94 |
25.71 - 27.11 |
1.3572 times |
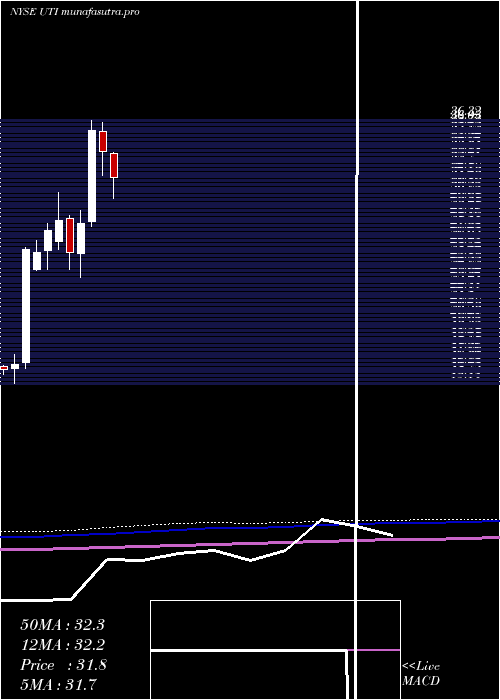
Monthly price and charts UniversalTechnical Strong monthly Stock price targets for UniversalTechnical UTI are 28.71 and 32.14 | Monthly Target 1 | 27.8 | | Monthly Target 2 | 29.62 | | Monthly Target 3 | 31.226666666667 | | Monthly Target 4 | 33.05 | | Monthly Target 5 | 34.66 |
Monthly price and volumes Universal Technical
| Date |
Closing |
Open |
Range |
Volume |
Mon 20 October 2025 |
31.45 (-3.38%) |
32.12 |
29.40 - 32.83 |
0.5388 times |
Tue 30 September 2025 |
32.55 (22.41%) |
26.30 |
26.30 - 33.17 |
1.0742 times |
Fri 29 August 2025 |
26.59 (-17.47%) |
32.32 |
25.15 - 33.49 |
1.373 times |
Thu 31 July 2025 |
32.22 (-4.93%) |
33.66 |
30.04 - 33.80 |
0.8642 times |
Mon 30 June 2025 |
33.89 (-4.62%) |
35.44 |
31.91 - 36.23 |
0.8699 times |
Fri 30 May 2025 |
35.53 (26.62%) |
28.20 |
27.82 - 36.32 |
1.5666 times |
Wed 30 April 2025 |
28.06 (9.27%) |
25.62 |
23.66 - 29.08 |
0.8129 times |
Mon 31 March 2025 |
25.68 (-9.07%) |
28.45 |
24.33 - 28.72 |
1.1073 times |
Fri 28 February 2025 |
28.24 (2.95%) |
26.61 |
25.90 - 30.56 |
1.0485 times |
Fri 31 January 2025 |
27.43 (6.69%) |
25.82 |
24.29 - 28.00 |
0.7447 times |
Tue 31 December 2024 |
25.71 (-0.92%) |
24.33 |
24.27 - 26.70 |
0.4297 times |
DMA SMA EMA moving averages of Universal Technical UTI
DMA (daily moving average) of Universal Technical UTI
| DMA period | DMA value | | 5 day DMA | 31.25 | | 12 day DMA | 30.9 | | 20 day DMA | 31.07 | | 35 day DMA | 29.62 | | 50 day DMA | 28.67 | | 100 day DMA | 30.63 | | 150 day DMA | 30.12 | | 200 day DMA | 29.35 | EMA (exponential moving average) of Universal Technical UTI
| EMA period | EMA current | EMA prev | EMA prev2 | | 5 day EMA | 31.08 | 30.89 | 30.96 | | 12 day EMA | 30.92 | 30.82 | 30.83 | | 20 day EMA | 30.59 | 30.5 | 30.47 | | 35 day EMA | 29.87 | 29.78 | 29.72 | | 50 day EMA | 28.95 | 28.85 | 28.77 |
SMA (simple moving average) of Universal Technical UTI
| SMA period | SMA current | SMA prev | SMA prev2 | | 5 day SMA | 31.25 | 31.03 | 30.86 | | 12 day SMA | 30.9 | 30.9 | 30.98 | | 20 day SMA | 31.07 | 30.96 | 30.83 | | 35 day SMA | 29.62 | 29.48 | 29.37 | | 50 day SMA | 28.67 | 28.55 | 28.47 | | 100 day SMA | 30.63 | 30.67 | 30.71 | | 150 day SMA | 30.12 | 30.1 | 30.07 | | 200 day SMA | 29.35 | 29.32 | 29.3 |
|
|
