US USPH full analysis,charts,indicators,moving averages,SMA,DMA,EMA,ADX,MACD,RSIU S USPH WideScreen charts, DMA,SMA,EMA technical analysis, forecast prediction, by indicators ADX,MACD,RSI,CCI NYSE stock exchange
operates under Health Care sector & deals in Medical Nursing Services
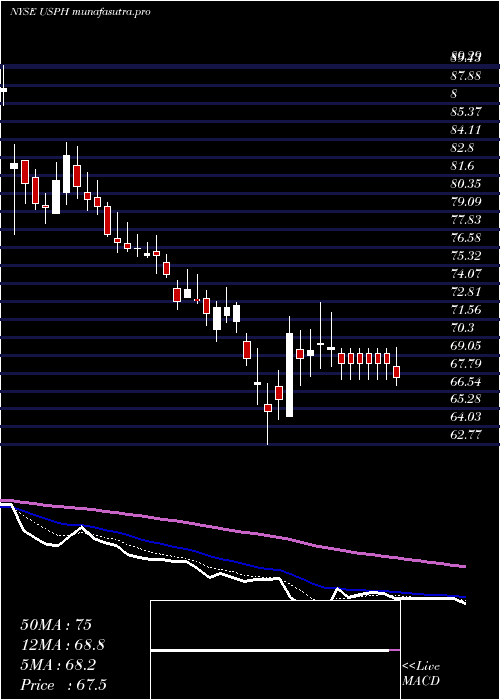
Daily price and charts and targets US Strong Daily Stock price targets for US USPH are 75.09 and 77.52 | Daily Target 1 | 73.06 | | Daily Target 2 | 74.68 | | Daily Target 3 | 75.49 | | Daily Target 4 | 77.11 | | Daily Target 5 | 77.92 |
Daily price and volume U S
| Date |
Closing |
Open |
Range |
Volume |
Thu 04 December 2025 |
76.30 (1.18%) |
75.41 |
73.87 - 76.30 |
0.7056 times |
Wed 03 December 2025 |
75.41 (2.64%) |
73.54 |
71.97 - 75.76 |
0.712 times |
Tue 02 December 2025 |
73.47 (-0.07%) |
73.73 |
71.77 - 74.30 |
0.8803 times |
Mon 01 December 2025 |
73.52 (-0.45%) |
72.93 |
72.85 - 74.44 |
0.6117 times |
Fri 28 November 2025 |
73.85 (-0.12%) |
74.79 |
73.10 - 74.79 |
0.3828 times |
Wed 26 November 2025 |
73.94 (-0.3%) |
73.77 |
73.30 - 75.28 |
1.3135 times |
Tue 25 November 2025 |
74.16 (3.72%) |
73.78 |
73.18 - 75.24 |
1.4133 times |
Mon 24 November 2025 |
71.50 (-0.18%) |
72.00 |
70.98 - 73.25 |
1.3773 times |
Fri 21 November 2025 |
71.63 (4.71%) |
68.70 |
68.70 - 73.93 |
1.3832 times |
Thu 20 November 2025 |
68.41 (0.63%) |
68.58 |
68.25 - 73.08 |
1.2202 times |
Wed 19 November 2025 |
67.98 (-1.39%) |
69.20 |
66.67 - 69.64 |
2.0915 times |
Weekly price and charts US Strong weekly Stock price targets for US USPH are 74.04 and 78.57 | Weekly Target 1 | 70.26 | | Weekly Target 2 | 73.28 | | Weekly Target 3 | 74.79 | | Weekly Target 4 | 77.81 | | Weekly Target 5 | 79.32 |
Weekly price and volumes for U S
| Date |
Closing |
Open |
Range |
Volume |
Thu 04 December 2025 |
76.30 (3.32%) |
72.93 |
71.77 - 76.30 |
0.7474 times |
Fri 28 November 2025 |
73.85 (3.1%) |
72.00 |
70.98 - 75.28 |
1.1525 times |
Fri 21 November 2025 |
71.63 (-0.06%) |
71.12 |
66.67 - 73.93 |
1.6882 times |
Fri 14 November 2025 |
71.67 (-2.98%) |
73.56 |
70.11 - 79.40 |
1.1438 times |
Fri 07 November 2025 |
73.87 (-14.37%) |
86.52 |
72.96 - 89.57 |
1.4421 times |
Fri 31 October 2025 |
86.27 (0%) |
85.88 |
84.22 - 87.25 |
0.1683 times |
Fri 31 October 2025 |
86.27 (-7.4%) |
93.26 |
84.22 - 93.26 |
0.9311 times |
Fri 24 October 2025 |
93.16 (4.76%) |
89.23 |
86.10 - 93.50 |
0.6094 times |
Fri 17 October 2025 |
88.93 (1.38%) |
88.42 |
87.13 - 92.63 |
0.9252 times |
Fri 10 October 2025 |
87.72 (-1.37%) |
88.54 |
87.25 - 91.16 |
1.1921 times |
Fri 03 October 2025 |
88.94 (6.64%) |
83.34 |
82.31 - 91.43 |
1.2721 times |
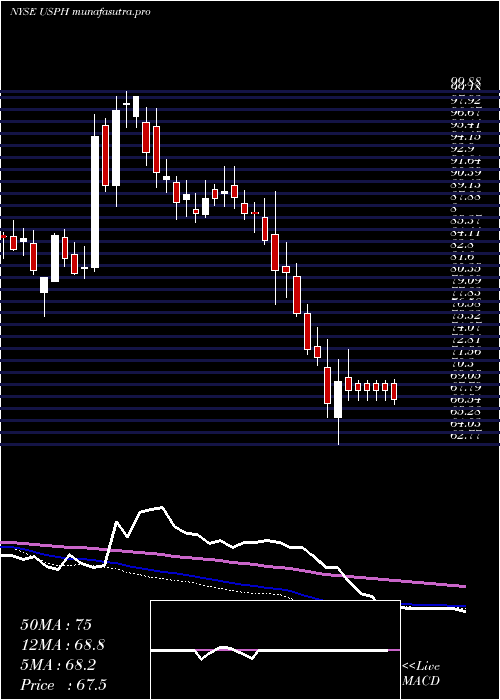
Monthly price and charts US Strong monthly Stock price targets for US USPH are 74.04 and 78.57 | Monthly Target 1 | 70.26 | | Monthly Target 2 | 73.28 | | Monthly Target 3 | 74.79 | | Monthly Target 4 | 77.81 | | Monthly Target 5 | 79.32 |
Monthly price and volumes U S
| Date |
Closing |
Open |
Range |
Volume |
Thu 04 December 2025 |
76.30 (3.32%) |
72.93 |
71.77 - 76.30 |
0.1823 times |
Fri 28 November 2025 |
73.85 (-14.4%) |
86.52 |
66.67 - 89.57 |
1.3234 times |
Fri 31 October 2025 |
86.27 (1.55%) |
84.22 |
83.44 - 93.50 |
1.1675 times |
Tue 30 September 2025 |
84.95 (2.49%) |
82.40 |
77.57 - 86.74 |
0.9477 times |
Fri 29 August 2025 |
82.89 (13.32%) |
73.06 |
69.92 - 89.06 |
1.1919 times |
Thu 31 July 2025 |
73.15 (-6.46%) |
77.90 |
72.19 - 82.18 |
1.4152 times |
Mon 30 June 2025 |
78.20 (4.28%) |
74.70 |
73.40 - 80.67 |
1.4681 times |
Fri 30 May 2025 |
74.99 (5.46%) |
71.00 |
68.61 - 81.19 |
0.7503 times |
Wed 30 April 2025 |
71.11 (-1.73%) |
71.81 |
62.77 - 73.78 |
0.8159 times |
Mon 31 March 2025 |
72.36 (-10.69%) |
81.45 |
69.99 - 83.95 |
0.7377 times |
Fri 28 February 2025 |
81.02 (-8.67%) |
88.04 |
77.50 - 89.46 |
0.7382 times |

DMA SMA EMA moving averages of U S USPH
DMA (daily moving average) of U S USPH
| DMA period | DMA value | | 5 day DMA | 74.51 | | 12 day DMA | 72.43 | | 20 day DMA | 72.68 | | 35 day DMA | 79.68 | | 50 day DMA | 82.06 | | 100 day DMA | 81.35 | | 150 day DMA | 79.66 | | 200 day DMA | 78.23 | EMA (exponential moving average) of U S USPH
| EMA period | EMA current | EMA prev | EMA prev2 | | 5 day EMA | 74.75 | 73.98 | 73.26 | | 12 day EMA | 74.06 | 73.65 | 73.33 | | 20 day EMA | 75.11 | 74.98 | 74.94 | | 35 day EMA | 77.4 | 77.47 | 77.59 | | 50 day EMA | 81.15 | 81.35 | 81.59 |
SMA (simple moving average) of U S USPH
| SMA period | SMA current | SMA prev | SMA prev2 | | 5 day SMA | 74.51 | 74.04 | 73.79 | | 12 day SMA | 72.43 | 71.9 | 71.59 | | 20 day SMA | 72.68 | 73.27 | 73.85 | | 35 day SMA | 79.68 | 80.12 | 80.57 | | 50 day SMA | 82.06 | 82.17 | 82.25 | | 100 day SMA | 81.35 | 81.32 | 81.3 | | 150 day SMA | 79.66 | 79.62 | 79.6 | | 200 day SMA | 78.23 | 78.28 | 78.34 |
|
|
