UsanaHealth USNA full analysis,charts,indicators,moving averages,SMA,DMA,EMA,ADX,MACD,RSIUsana Health USNA WideScreen charts, DMA,SMA,EMA technical analysis, forecast prediction, by indicators ADX,MACD,RSI,CCI NYSE stock exchange
operates under Consumer Durables sector & deals in Specialty Chemicals
Daily price and charts and targets UsanaHealth Strong Daily Stock price targets for UsanaHealth USNA are 20.82 and 21.35 | Daily Target 1 | 20.44 | | Daily Target 2 | 20.66 | | Daily Target 3 | 20.966666666667 | | Daily Target 4 | 21.19 | | Daily Target 5 | 21.5 |
Daily price and volume Usana Health
| Date |
Closing |
Open |
Range |
Volume |
Fri 17 October 2025 |
20.89 (-0.85%) |
20.88 |
20.74 - 21.27 |
1.1622 times |
Thu 16 October 2025 |
21.07 (2.73%) |
20.56 |
20.56 - 21.38 |
1.5992 times |
Wed 15 October 2025 |
20.51 (-3.3%) |
21.40 |
20.33 - 21.46 |
1.1509 times |
Tue 14 October 2025 |
21.21 (3.31%) |
20.27 |
20.19 - 21.23 |
1.5055 times |
Mon 13 October 2025 |
20.53 (-22.03%) |
20.30 |
19.88 - 20.63 |
1.8846 times |
Tue 07 October 2025 |
26.33 (-0.94%) |
26.44 |
26.19 - 26.76 |
0.7632 times |
Mon 06 October 2025 |
26.58 (-2.14%) |
27.17 |
26.57 - 27.25 |
0.3686 times |
Fri 03 October 2025 |
27.16 (-1.02%) |
27.44 |
27.03 - 27.95 |
0.5709 times |
Thu 02 October 2025 |
27.44 (0.62%) |
27.20 |
26.88 - 27.45 |
0.3053 times |
Wed 01 October 2025 |
27.27 (-1.02%) |
27.43 |
27.05 - 27.69 |
0.6898 times |
Tue 30 September 2025 |
27.55 (-0.4%) |
27.64 |
27.25 - 27.86 |
0.7562 times |
Weekly price and charts UsanaHealth Strong weekly Stock price targets for UsanaHealth USNA are 20.39 and 21.97 | Weekly Target 1 | 19.16 | | Weekly Target 2 | 20.03 | | Weekly Target 3 | 20.743333333333 | | Weekly Target 4 | 21.61 | | Weekly Target 5 | 22.32 |
Weekly price and volumes for Usana Health
| Date |
Closing |
Open |
Range |
Volume |
Fri 17 October 2025 |
20.89 (-20.66%) |
20.30 |
19.88 - 21.46 |
2.3147 times |
Tue 07 October 2025 |
26.33 (-3.06%) |
27.17 |
26.19 - 27.25 |
0.3587 times |
Fri 03 October 2025 |
27.16 (-4.8%) |
28.52 |
26.88 - 28.52 |
0.9271 times |
Fri 26 September 2025 |
28.53 (-4.07%) |
29.74 |
28.15 - 30.10 |
1.0838 times |
Fri 19 September 2025 |
29.74 (-2.52%) |
30.60 |
29.53 - 31.15 |
1.4744 times |
Fri 12 September 2025 |
30.51 (-4.12%) |
31.76 |
29.67 - 31.79 |
1.2729 times |
Fri 05 September 2025 |
31.82 (-0.28%) |
31.68 |
30.95 - 32.29 |
0.8789 times |
Fri 29 August 2025 |
31.91 (0%) |
31.46 |
31.46 - 31.96 |
0.1311 times |
Fri 29 August 2025 |
31.91 (-1.02%) |
32.02 |
31.38 - 32.25 |
0.7636 times |
Fri 22 August 2025 |
32.24 (6.05%) |
30.40 |
30.18 - 32.32 |
0.7948 times |
Fri 15 August 2025 |
30.40 (5.37%) |
29.02 |
28.99 - 31.48 |
0.8804 times |

Monthly price and charts UsanaHealth Strong monthly Stock price targets for UsanaHealth USNA are 16.35 and 24.42 | Monthly Target 1 | 14.84 | | Monthly Target 2 | 17.86 | | Monthly Target 3 | 22.906666666667 | | Monthly Target 4 | 25.93 | | Monthly Target 5 | 30.98 |
Monthly price and volumes Usana Health
| Date |
Closing |
Open |
Range |
Volume |
Fri 17 October 2025 |
20.89 (-24.17%) |
27.43 |
19.88 - 27.95 |
0.5717 times |
Tue 30 September 2025 |
27.55 (-13.66%) |
31.68 |
27.25 - 32.29 |
0.9272 times |
Fri 29 August 2025 |
31.91 (8.57%) |
29.19 |
28.45 - 32.32 |
0.6458 times |
Thu 31 July 2025 |
29.39 (-3.73%) |
30.49 |
28.89 - 38.32 |
0.9171 times |
Mon 30 June 2025 |
30.53 (2.21%) |
29.74 |
28.92 - 31.43 |
0.9478 times |
Fri 30 May 2025 |
29.87 (6.34%) |
27.98 |
27.50 - 31.49 |
1.22 times |
Wed 30 April 2025 |
28.09 (4.15%) |
26.58 |
23.10 - 28.41 |
1.3068 times |
Mon 31 March 2025 |
26.97 (-8.85%) |
29.56 |
26.64 - 33.88 |
1.4142 times |
Fri 28 February 2025 |
29.59 (-9.15%) |
32.11 |
27.71 - 36.33 |
1.2403 times |
Fri 31 January 2025 |
32.57 (-9.25%) |
36.59 |
32.50 - 36.99 |
0.809 times |
Tue 31 December 2024 |
35.89 (-5.65%) |
38.38 |
31.44 - 38.84 |
0.6725 times |

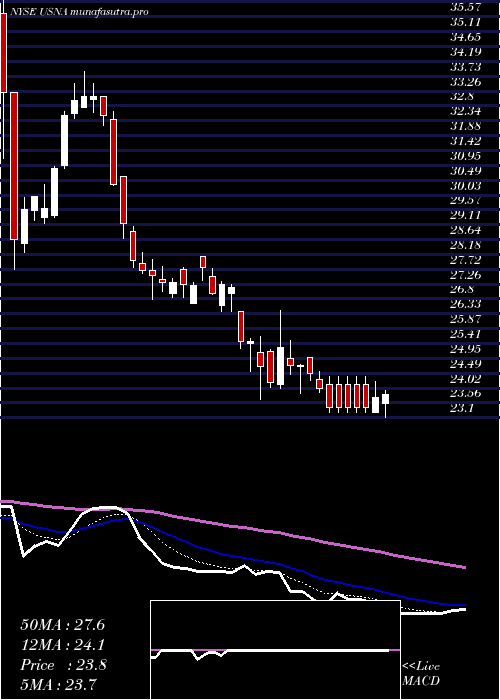
DMA SMA EMA moving averages of Usana Health USNA
DMA (daily moving average) of Usana Health USNA
| DMA period | DMA value | | 5 day DMA | 20.84 | | 12 day DMA | 24.52 | | 20 day DMA | 26.47 | | 35 day DMA | 28.48 | | 50 day DMA | 29.08 | | 100 day DMA | 29.93 | | 150 day DMA | 28.99 | | 200 day DMA | 29.97 | EMA (exponential moving average) of Usana Health USNA
| EMA period | EMA current | EMA prev | EMA prev2 | | 5 day EMA | 21.68 | 22.07 | 22.57 | | 12 day EMA | 23.86 | 24.4 | 25.01 | | 20 day EMA | 25.47 | 25.95 | 26.46 | | 35 day EMA | 27.08 | 27.44 | 27.81 | | 50 day EMA | 28.29 | 28.59 | 28.9 |
SMA (simple moving average) of Usana Health USNA
| SMA period | SMA current | SMA prev | SMA prev2 | | 5 day SMA | 20.84 | 21.93 | 23.03 | | 12 day SMA | 24.52 | 25.15 | 25.76 | | 20 day SMA | 26.47 | 26.95 | 27.4 | | 35 day SMA | 28.48 | 28.79 | 29.1 | | 50 day SMA | 29.08 | 29.24 | 29.4 | | 100 day SMA | 29.93 | 30.03 | 30.12 | | 150 day SMA | 28.99 | 29.07 | 29.15 | | 200 day SMA | 29.97 | 30.05 | 30.12 |
|
|
