UsBancorp USB-P full analysis,charts,indicators,moving averages,SMA,DMA,EMA,ADX,MACD,RSIUs Bancorp USB-P WideScreen charts, DMA,SMA,EMA technical analysis, forecast prediction, by indicators ADX,MACD,RSI,CCI NYSE stock exchange
Daily price and charts and targets UsBancorp Strong Daily Stock price targets for UsBancorp USB-P are 22.53 and 22.72 | Daily Target 1 | 22.45 | | Daily Target 2 | 22.53 | | Daily Target 3 | 22.636666666667 | | Daily Target 4 | 22.72 | | Daily Target 5 | 22.83 |
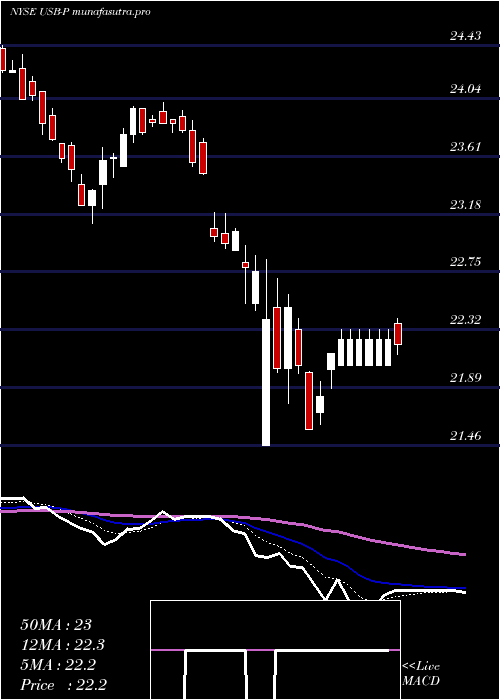
Daily price and volume Us Bancorp
| Date |
Closing |
Open |
Range |
Volume |
Fri 05 December 2025 |
22.62 (0%) |
22.62 |
22.55 - 22.74 |
1.326 times |
Thu 04 December 2025 |
22.62 (-0.31%) |
22.63 |
22.61 - 22.82 |
0.9852 times |
Wed 03 December 2025 |
22.69 (-0.13%) |
22.72 |
22.61 - 22.77 |
1.1523 times |
Tue 02 December 2025 |
22.72 (-0.13%) |
22.75 |
22.56 - 22.79 |
1.3281 times |
Mon 01 December 2025 |
22.75 (-0.57%) |
22.85 |
22.75 - 22.87 |
0.8008 times |
Fri 28 November 2025 |
22.88 (0.44%) |
22.78 |
22.76 - 22.88 |
0.8637 times |
Wed 26 November 2025 |
22.78 (0.35%) |
22.72 |
22.67 - 22.87 |
0.7899 times |
Tue 25 November 2025 |
22.70 (0.4%) |
22.66 |
22.61 - 22.75 |
0.8898 times |
Mon 24 November 2025 |
22.61 (0.13%) |
22.65 |
22.58 - 22.79 |
0.9679 times |
Fri 21 November 2025 |
22.58 (0.27%) |
22.60 |
22.50 - 22.69 |
0.8963 times |
Thu 20 November 2025 |
22.52 (-0.75%) |
22.77 |
22.50 - 22.77 |
0.931 times |
Weekly price and charts UsBancorp Strong weekly Stock price targets for UsBancorp USB-P are 22.43 and 22.75 | Weekly Target 1 | 22.36 | | Weekly Target 2 | 22.49 | | Weekly Target 3 | 22.68 | | Weekly Target 4 | 22.81 | | Weekly Target 5 | 23 |
Weekly price and volumes for Us Bancorp
| Date |
Closing |
Open |
Range |
Volume |
Fri 05 December 2025 |
22.62 (-1.14%) |
22.85 |
22.55 - 22.87 |
1.2834 times |
Fri 28 November 2025 |
22.88 (1.33%) |
22.65 |
22.58 - 22.88 |
0.8058 times |
Fri 21 November 2025 |
22.58 (-2.21%) |
23.17 |
22.50 - 23.17 |
1.0956 times |
Fri 14 November 2025 |
23.09 (-1.66%) |
23.46 |
23.04 - 23.65 |
0.8217 times |
Fri 07 November 2025 |
23.48 (-0.34%) |
23.33 |
23.20 - 23.60 |
0.9442 times |
Fri 31 October 2025 |
23.56 (0%) |
23.67 |
23.54 - 23.74 |
0.3546 times |
Fri 31 October 2025 |
23.56 (-1.79%) |
24.13 |
23.54 - 24.13 |
1.0752 times |
Fri 24 October 2025 |
23.99 (0.59%) |
23.87 |
23.76 - 24.14 |
1.011 times |
Fri 17 October 2025 |
23.85 (-0.13%) |
23.92 |
23.79 - 24.15 |
0.8491 times |
Fri 10 October 2025 |
23.88 (-2.33%) |
24.42 |
23.78 - 24.63 |
1.7595 times |
Fri 03 October 2025 |
24.45 (-0.97%) |
24.70 |
24.25 - 24.80 |
0.8108 times |

Monthly price and charts UsBancorp Strong monthly Stock price targets for UsBancorp USB-P are 22.43 and 22.75 | Monthly Target 1 | 22.36 | | Monthly Target 2 | 22.49 | | Monthly Target 3 | 22.68 | | Monthly Target 4 | 22.81 | | Monthly Target 5 | 23 |
Monthly price and volumes Us Bancorp
| Date |
Closing |
Open |
Range |
Volume |
Fri 05 December 2025 |
22.62 (-1.14%) |
22.85 |
22.55 - 22.87 |
0.2781 times |
Fri 28 November 2025 |
22.88 (-2.89%) |
23.33 |
22.50 - 23.65 |
0.7946 times |
Fri 31 October 2025 |
23.56 (-2.97%) |
24.30 |
23.54 - 24.73 |
1.17 times |
Tue 30 September 2025 |
24.28 (1.89%) |
23.75 |
23.59 - 24.98 |
1.4457 times |
Fri 29 August 2025 |
23.83 (3.03%) |
22.95 |
22.94 - 24.14 |
1.2 times |
Thu 31 July 2025 |
23.13 (4.47%) |
22.23 |
22.16 - 23.16 |
0.9411 times |
Mon 30 June 2025 |
22.14 (-2.38%) |
22.68 |
22.14 - 23.01 |
0.984 times |
Fri 30 May 2025 |
22.68 (1.84%) |
22.37 |
22.20 - 23.13 |
1.027 times |
Wed 30 April 2025 |
22.27 (-3.22%) |
23.03 |
21.46 - 23.18 |
1.2268 times |
Mon 31 March 2025 |
23.01 (-4.24%) |
24.16 |
22.97 - 24.20 |
0.9329 times |
Fri 28 February 2025 |
24.03 (1.48%) |
23.67 |
23.46 - 24.43 |
0.526 times |

DMA SMA EMA moving averages of Us Bancorp USB-P
DMA (daily moving average) of Us Bancorp USB-P
| DMA period | DMA value | | 5 day DMA | 22.68 | | 12 day DMA | 22.68 | | 20 day DMA | 22.9 | | 35 day DMA | 23.28 | | 50 day DMA | 23.58 | | 100 day DMA | 23.63 | | 150 day DMA | 23.3 | | 200 day DMA | 23.24 | EMA (exponential moving average) of Us Bancorp USB-P
| EMA period | EMA current | EMA prev | EMA prev2 | | 5 day EMA | 22.67 | 22.69 | 22.73 | | 12 day EMA | 22.77 | 22.8 | 22.83 | | 20 day EMA | 22.93 | 22.96 | 23 | | 35 day EMA | 23.22 | 23.26 | 23.3 | | 50 day EMA | 23.59 | 23.63 | 23.67 |
SMA (simple moving average) of Us Bancorp USB-P
| SMA period | SMA current | SMA prev | SMA prev2 | | 5 day SMA | 22.68 | 22.73 | 22.76 | | 12 day SMA | 22.68 | 22.7 | 22.72 | | 20 day SMA | 22.9 | 22.94 | 22.98 | | 35 day SMA | 23.28 | 23.31 | 23.35 | | 50 day SMA | 23.58 | 23.62 | 23.66 | | 100 day SMA | 23.63 | 23.63 | 23.63 | | 150 day SMA | 23.3 | 23.29 | 23.29 | | 200 day SMA | 23.24 | 23.24 | 23.25 |
|
|
