US USB full analysis,charts,indicators,moving averages,SMA,DMA,EMA,ADX,MACD,RSIU S USB WideScreen charts, DMA,SMA,EMA technical analysis, forecast prediction, by indicators ADX,MACD,RSI,CCI NYSE stock exchange
operates under Finance sector & deals in Major Banks
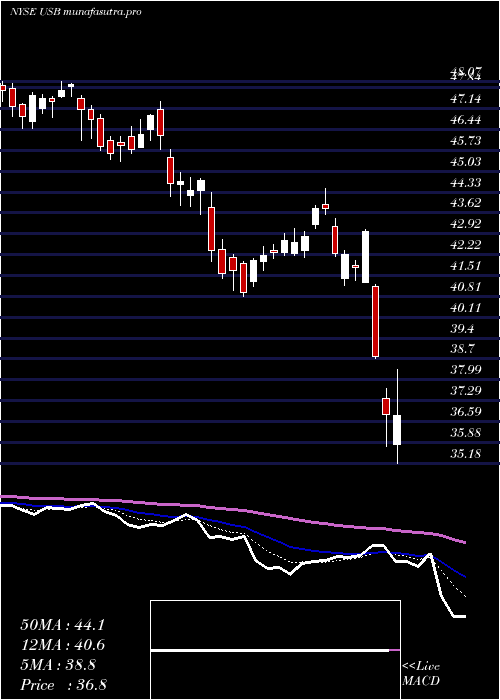
Daily price and charts and targets US Strong Daily Stock price targets for US USB are 51.14 and 51.75 | Daily Target 1 | 50.65 | | Daily Target 2 | 51.01 | | Daily Target 3 | 51.26 | | Daily Target 4 | 51.62 | | Daily Target 5 | 51.87 |
Daily price and volume U S
| Date |
Closing |
Open |
Range |
Volume |
Thu 04 December 2025 |
51.37 (0.86%) |
50.95 |
50.90 - 51.51 |
1.0121 times |
Wed 03 December 2025 |
50.93 (2.52%) |
49.96 |
49.79 - 50.96 |
1.2243 times |
Tue 02 December 2025 |
49.68 (0.55%) |
49.63 |
49.17 - 49.98 |
1.3794 times |
Mon 01 December 2025 |
49.41 (0.73%) |
48.94 |
48.92 - 49.85 |
1.1473 times |
Fri 28 November 2025 |
49.05 (0.2%) |
48.91 |
48.84 - 49.26 |
0.4193 times |
Wed 26 November 2025 |
48.95 (0.06%) |
48.92 |
48.74 - 49.30 |
0.5692 times |
Tue 25 November 2025 |
48.92 (2.45%) |
47.80 |
47.72 - 49.19 |
0.7969 times |
Mon 24 November 2025 |
47.75 (-0.06%) |
47.77 |
47.22 - 47.93 |
1.4004 times |
Fri 21 November 2025 |
47.78 (2.77%) |
46.83 |
46.63 - 48.15 |
1.0065 times |
Thu 20 November 2025 |
46.49 (-0.66%) |
47.20 |
46.43 - 47.76 |
1.0446 times |
Wed 19 November 2025 |
46.80 (1.92%) |
45.88 |
45.80 - 46.84 |
1.1375 times |
Weekly price and charts US Strong weekly Stock price targets for US USB are 50.15 and 52.74 | Weekly Target 1 | 48.01 | | Weekly Target 2 | 49.69 | | Weekly Target 3 | 50.6 | | Weekly Target 4 | 52.28 | | Weekly Target 5 | 53.19 |
Weekly price and volumes for U S
| Date |
Closing |
Open |
Range |
Volume |
Thu 04 December 2025 |
51.37 (4.73%) |
48.94 |
48.92 - 51.51 |
1.0624 times |
Fri 28 November 2025 |
49.05 (2.66%) |
47.77 |
47.22 - 49.30 |
0.7106 times |
Fri 21 November 2025 |
47.78 (1.44%) |
46.90 |
45.02 - 48.15 |
1.1637 times |
Fri 14 November 2025 |
47.10 (-0.46%) |
47.41 |
46.67 - 48.51 |
0.8129 times |
Fri 07 November 2025 |
47.32 (1.37%) |
46.45 |
46.02 - 47.34 |
0.6863 times |
Fri 31 October 2025 |
46.68 (0%) |
46.43 |
46.08 - 46.87 |
0.2748 times |
Fri 31 October 2025 |
46.68 (-3.27%) |
48.44 |
46.08 - 48.49 |
1.2397 times |
Fri 24 October 2025 |
48.26 (5.62%) |
45.97 |
45.91 - 48.60 |
1.3785 times |
Fri 17 October 2025 |
45.69 (0.91%) |
45.89 |
44.36 - 48.24 |
1.5784 times |
Fri 10 October 2025 |
45.28 (-5.88%) |
48.31 |
45.23 - 49.00 |
1.0926 times |
Fri 03 October 2025 |
48.11 (-2.69%) |
49.42 |
47.47 - 49.51 |
1.273 times |
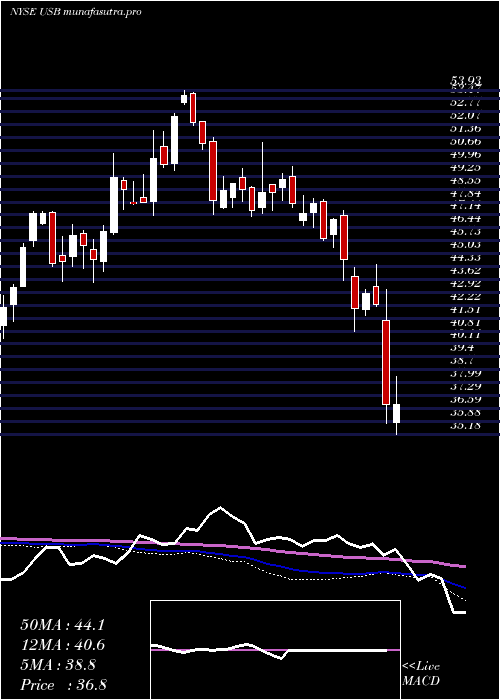
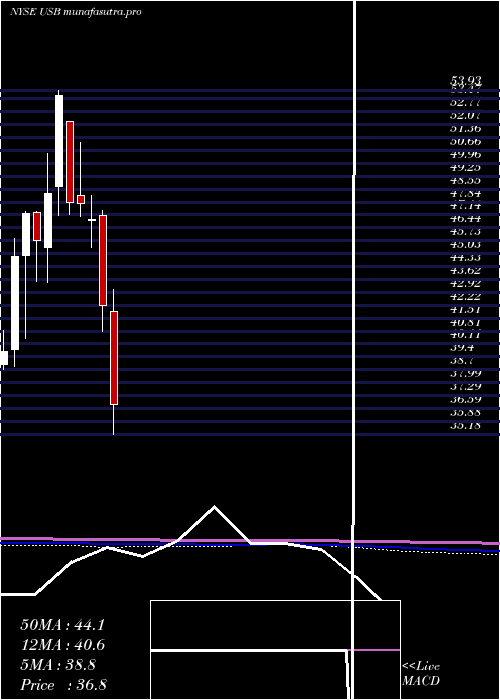
Monthly price and charts US Strong monthly Stock price targets for US USB are 50.15 and 52.74 | Monthly Target 1 | 48.01 | | Monthly Target 2 | 49.69 | | Monthly Target 3 | 50.6 | | Monthly Target 4 | 52.28 | | Monthly Target 5 | 53.19 |
Monthly price and volumes U S
| Date |
Closing |
Open |
Range |
Volume |
Thu 04 December 2025 |
51.37 (4.73%) |
48.94 |
48.92 - 51.51 |
0.193 times |
Fri 28 November 2025 |
49.05 (5.08%) |
46.45 |
45.02 - 49.30 |
0.6128 times |
Fri 31 October 2025 |
46.68 (-3.41%) |
48.18 |
44.36 - 49.00 |
1.1406 times |
Tue 30 September 2025 |
48.33 (-1.02%) |
48.34 |
47.47 - 50.52 |
1.0747 times |
Fri 29 August 2025 |
48.83 (8.61%) |
44.32 |
43.46 - 49.06 |
0.9032 times |
Thu 31 July 2025 |
44.96 (-0.64%) |
44.97 |
44.02 - 48.39 |
1.4274 times |
Mon 30 June 2025 |
45.25 (3.81%) |
43.31 |
42.55 - 46.25 |
1.0419 times |
Fri 30 May 2025 |
43.59 (8.06%) |
40.16 |
39.99 - 45.00 |
0.7854 times |
Wed 30 April 2025 |
40.34 (-4.45%) |
41.86 |
35.18 - 43.07 |
1.4166 times |
Mon 31 March 2025 |
42.22 (-9.98%) |
47.11 |
40.81 - 47.37 |
1.4044 times |
Fri 28 February 2025 |
46.90 (-1.84%) |
46.84 |
45.37 - 48.20 |
0.8405 times |
DMA SMA EMA moving averages of U S USB
DMA (daily moving average) of U S USB
| DMA period | DMA value | | 5 day DMA | 50.09 | | 12 day DMA | 48.59 | | 20 day DMA | 48.01 | | 35 day DMA | 47.57 | | 50 day DMA | 47.58 | | 100 day DMA | 47.42 | | 150 day DMA | 46.4 | | 200 day DMA | 45.2 | EMA (exponential moving average) of U S USB
| EMA period | EMA current | EMA prev | EMA prev2 | | 5 day EMA | 50.26 | 49.7 | 49.08 | | 12 day EMA | 49.12 | 48.71 | 48.31 | | 20 day EMA | 48.52 | 48.22 | 47.93 | | 35 day EMA | 48.17 | 47.98 | 47.81 | | 50 day EMA | 48.01 | 47.87 | 47.75 |
SMA (simple moving average) of U S USB
| SMA period | SMA current | SMA prev | SMA prev2 | | 5 day SMA | 50.09 | 49.6 | 49.2 | | 12 day SMA | 48.59 | 48.1 | 47.78 | | 20 day SMA | 48.01 | 47.78 | 47.55 | | 35 day SMA | 47.57 | 47.43 | 47.32 | | 50 day SMA | 47.58 | 47.54 | 47.5 | | 100 day SMA | 47.42 | 47.37 | 47.33 | | 150 day SMA | 46.4 | 46.33 | 46.26 | | 200 day SMA | 45.2 | 45.18 | 45.17 |
|
|
