UnitedRentals URI full analysis,charts,indicators,moving averages,SMA,DMA,EMA,ADX,MACD,RSIUnited Rentals URI WideScreen charts, DMA,SMA,EMA technical analysis, forecast prediction, by indicators ADX,MACD,RSI,CCI NYSE stock exchange
operates under Technology sector & deals in Diversified Commercial Services
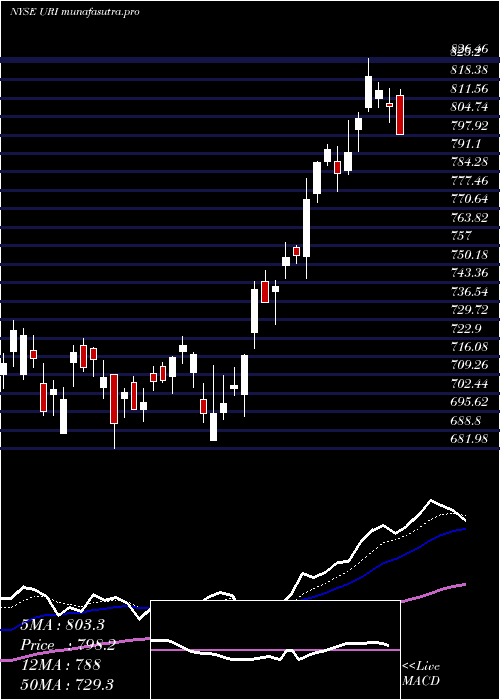
Daily price and charts and targets UnitedRentals Strong Daily Stock price targets for UnitedRentals URI are 794.46 and 816.06 | Daily Target 1 | 789.97 | | Daily Target 2 | 798.94 | | Daily Target 3 | 811.57333333333 | | Daily Target 4 | 820.54 | | Daily Target 5 | 833.17 |
Daily price and volume United Rentals
| Date |
Closing |
Open |
Range |
Volume |
Thu 04 December 2025 |
807.90 (-0.71%) |
817.93 |
802.61 - 824.21 |
0.6734 times |
Wed 03 December 2025 |
813.66 (1.6%) |
800.60 |
797.00 - 816.12 |
1.0219 times |
Tue 02 December 2025 |
800.83 (-0.55%) |
810.66 |
798.88 - 812.26 |
0.6609 times |
Mon 01 December 2025 |
805.24 (-1.22%) |
809.31 |
802.30 - 815.67 |
0.7849 times |
Fri 28 November 2025 |
815.18 (0.03%) |
820.05 |
814.19 - 823.01 |
0.3384 times |
Wed 26 November 2025 |
814.97 (0.61%) |
814.42 |
806.59 - 819.17 |
1.0156 times |
Tue 25 November 2025 |
810.00 (-0.12%) |
813.86 |
805.78 - 821.64 |
1.4197 times |
Mon 24 November 2025 |
811.00 (1.38%) |
801.10 |
798.10 - 817.85 |
1.2284 times |
Fri 21 November 2025 |
800.00 (3.9%) |
776.48 |
772.57 - 815.94 |
1.7041 times |
Thu 20 November 2025 |
770.00 (-2.81%) |
806.60 |
769.88 - 813.92 |
1.1528 times |
Wed 19 November 2025 |
792.27 (-1.03%) |
800.08 |
791.45 - 809.47 |
0.7995 times |
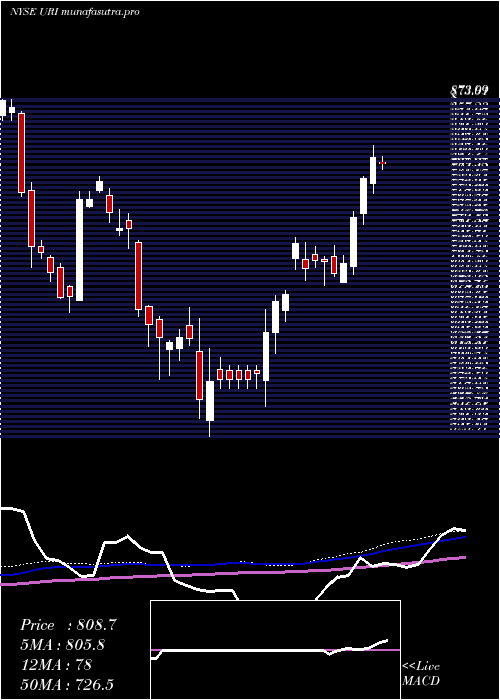
Weekly price and charts UnitedRentals Strong weekly Stock price targets for UnitedRentals URI are 788.85 and 816.06 | Weekly Target 1 | 782.49 | | Weekly Target 2 | 795.2 | | Weekly Target 3 | 809.70333333333 | | Weekly Target 4 | 822.41 | | Weekly Target 5 | 836.91 |
Weekly price and volumes for United Rentals
| Date |
Closing |
Open |
Range |
Volume |
Thu 04 December 2025 |
807.90 (-0.89%) |
809.31 |
797.00 - 824.21 |
0.9586 times |
Fri 28 November 2025 |
815.18 (1.9%) |
801.10 |
798.10 - 823.01 |
1.2214 times |
Fri 21 November 2025 |
800.00 (-4.08%) |
834.03 |
769.88 - 836.50 |
1.736 times |
Fri 14 November 2025 |
834.03 (-1.68%) |
855.78 |
829.01 - 866.86 |
0.8115 times |
Fri 07 November 2025 |
848.25 (-2.63%) |
850.00 |
833.45 - 859.48 |
0.8263 times |
Fri 31 October 2025 |
871.18 (0%) |
857.82 |
850.00 - 883.48 |
0.2747 times |
Fri 31 October 2025 |
871.18 (-4.61%) |
918.59 |
850.00 - 920.43 |
1.3892 times |
Fri 24 October 2025 |
913.33 (-6.84%) |
986.22 |
907.61 - 1015.68 |
1.2668 times |
Fri 17 October 2025 |
980.37 (3.19%) |
960.10 |
955.42 - 1021.47 |
0.8369 times |
Fri 10 October 2025 |
950.03 (-3.14%) |
982.19 |
949.91 - 1004.92 |
0.6785 times |
Fri 03 October 2025 |
980.80 (3.54%) |
956.74 |
935.98 - 997.50 |
0.6763 times |
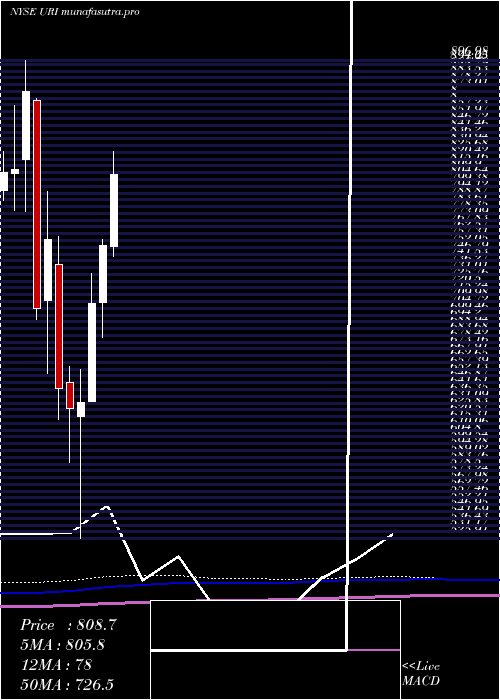
Monthly price and charts UnitedRentals Strong monthly Stock price targets for UnitedRentals URI are 788.85 and 816.06 | Monthly Target 1 | 782.49 | | Monthly Target 2 | 795.2 | | Monthly Target 3 | 809.70333333333 | | Monthly Target 4 | 822.41 | | Monthly Target 5 | 836.91 |
Monthly price and volumes United Rentals
| Date |
Closing |
Open |
Range |
Volume |
Thu 04 December 2025 |
807.90 (-0.89%) |
809.31 |
797.00 - 824.21 |
0.2184 times |
Fri 28 November 2025 |
815.18 (-6.43%) |
850.00 |
769.88 - 866.86 |
1.0469 times |
Fri 31 October 2025 |
871.18 (-8.74%) |
967.00 |
850.00 - 1021.47 |
1.0953 times |
Tue 30 September 2025 |
954.66 (-0.18%) |
943.37 |
913.59 - 980.53 |
0.9726 times |
Fri 29 August 2025 |
956.34 (8.31%) |
860.88 |
842.17 - 961.16 |
0.9213 times |
Thu 31 July 2025 |
882.94 (17.19%) |
752.98 |
745.04 - 903.61 |
1.3248 times |
Mon 30 June 2025 |
753.40 (6.36%) |
709.40 |
681.98 - 758.33 |
0.7977 times |
Fri 30 May 2025 |
708.38 (12.18%) |
632.25 |
632.25 - 732.00 |
1.0427 times |
Wed 30 April 2025 |
631.45 (0.76%) |
620.63 |
525.91 - 657.00 |
1.322 times |
Mon 31 March 2025 |
626.70 (-2.43%) |
647.00 |
585.27 - 659.74 |
1.2583 times |
Fri 28 February 2025 |
642.32 (-15.27%) |
738.89 |
618.63 - 760.36 |
1.1047 times |
DMA SMA EMA moving averages of United Rentals URI
DMA (daily moving average) of United Rentals URI
| DMA period | DMA value | | 5 day DMA | 808.56 | | 12 day DMA | 803.46 | | 20 day DMA | 819.45 | | 35 day DMA | 861.2 | | 50 day DMA | 894.74 | | 100 day DMA | 901.04 | | 150 day DMA | 841.72 | | 200 day DMA | 784.69 | EMA (exponential moving average) of United Rentals URI
| EMA period | EMA current | EMA prev | EMA prev2 | | 5 day EMA | 808.43 | 808.69 | 806.2 | | 12 day EMA | 812.71 | 813.58 | 813.57 | | 20 day EMA | 825.53 | 827.39 | 828.84 | | 35 day EMA | 856.2 | 859.04 | 861.71 | | 50 day EMA | 890.17 | 893.53 | 896.79 |
SMA (simple moving average) of United Rentals URI
| SMA period | SMA current | SMA prev | SMA prev2 | | 5 day SMA | 808.56 | 809.98 | 809.24 | | 12 day SMA | 803.46 | 803.36 | 805.05 | | 20 day SMA | 819.45 | 821.28 | 823.24 | | 35 day SMA | 861.2 | 867.26 | 872.6 | | 50 day SMA | 894.74 | 897.29 | 900.13 | | 100 day SMA | 901.04 | 900.94 | 900.89 | | 150 day SMA | 841.72 | 840.54 | 839.32 | | 200 day SMA | 784.69 | 784.2 | 783.73 |
|
|
