UnumGroup UNMA full analysis,charts,indicators,moving averages,SMA,DMA,EMA,ADX,MACD,RSIUnum Group UNMA WideScreen charts, DMA,SMA,EMA technical analysis, forecast prediction, by indicators ADX,MACD,RSI,CCI NYSE stock exchange
operates under Finance sector & deals in Accident Health Insurance
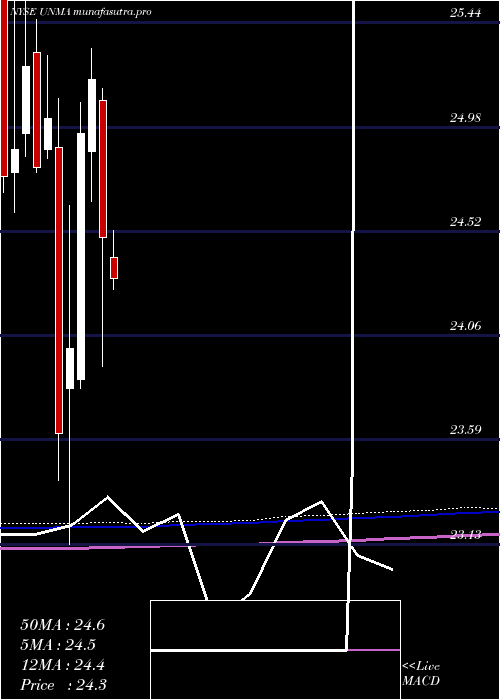
Daily price and charts and targets UnumGroup Strong Daily Stock price targets for UnumGroup UNMA are 23.61 and 23.91 | Daily Target 1 | 23.37 | | Daily Target 2 | 23.55 | | Daily Target 3 | 23.673333333333 | | Daily Target 4 | 23.85 | | Daily Target 5 | 23.97 |
Daily price and volume Unum Group
| Date |
Closing |
Open |
Range |
Volume |
Fri 05 December 2025 |
23.72 (0.3%) |
23.68 |
23.50 - 23.80 |
1.8224 times |
Thu 04 December 2025 |
23.65 (-0.59%) |
23.68 |
23.60 - 23.71 |
1.0934 times |
Wed 03 December 2025 |
23.79 (0.98%) |
23.48 |
23.48 - 23.89 |
1.1688 times |
Tue 02 December 2025 |
23.56 (-0.04%) |
23.50 |
23.49 - 23.65 |
1.4286 times |
Mon 01 December 2025 |
23.57 (-1.13%) |
23.55 |
23.35 - 23.57 |
2.212 times |
Fri 28 November 2025 |
23.84 (0.13%) |
23.74 |
23.66 - 23.84 |
0.1676 times |
Wed 26 November 2025 |
23.81 (0.55%) |
23.66 |
23.63 - 23.82 |
0.4943 times |
Tue 25 November 2025 |
23.68 (-0.21%) |
23.72 |
23.66 - 23.88 |
0.5362 times |
Mon 24 November 2025 |
23.73 (-0.04%) |
23.83 |
23.68 - 23.94 |
0.7876 times |
Fri 21 November 2025 |
23.74 (0.04%) |
23.66 |
23.66 - 23.83 |
0.2891 times |
Thu 20 November 2025 |
23.73 (-0.54%) |
23.87 |
23.66 - 23.91 |
0.4273 times |
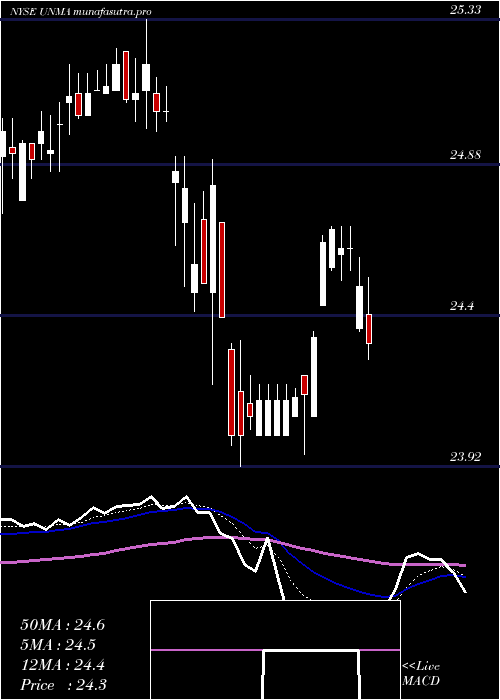
Weekly price and charts UnumGroup Strong weekly Stock price targets for UnumGroup UNMA are 23.54 and 24.08 | Weekly Target 1 | 23.11 | | Weekly Target 2 | 23.42 | | Weekly Target 3 | 23.653333333333 | | Weekly Target 4 | 23.96 | | Weekly Target 5 | 24.19 |
Weekly price and volumes for Unum Group
| Date |
Closing |
Open |
Range |
Volume |
Fri 05 December 2025 |
23.72 (-0.5%) |
23.55 |
23.35 - 23.89 |
2.8444 times |
Fri 28 November 2025 |
23.84 (0.42%) |
23.83 |
23.63 - 23.94 |
0.7312 times |
Fri 21 November 2025 |
23.74 (-0.71%) |
23.74 |
23.66 - 23.91 |
0.8191 times |
Fri 14 November 2025 |
23.91 (1.18%) |
23.69 |
23.53 - 23.93 |
0.9749 times |
Fri 07 November 2025 |
23.63 (-0.42%) |
23.65 |
23.47 - 23.75 |
0.9594 times |
Fri 31 October 2025 |
23.73 (0%) |
23.85 |
23.65 - 24.21 |
0.4011 times |
Fri 31 October 2025 |
23.73 (-2.22%) |
24.18 |
23.65 - 24.36 |
0.9379 times |
Fri 24 October 2025 |
24.27 (0.33%) |
24.20 |
24.10 - 24.49 |
0.6556 times |
Fri 17 October 2025 |
24.19 (0.75%) |
24.00 |
23.80 - 24.33 |
0.7404 times |
Fri 10 October 2025 |
24.01 (-1.36%) |
24.28 |
23.87 - 24.40 |
0.9362 times |
Fri 03 October 2025 |
24.34 (0.04%) |
24.27 |
24.04 - 24.59 |
0.9102 times |
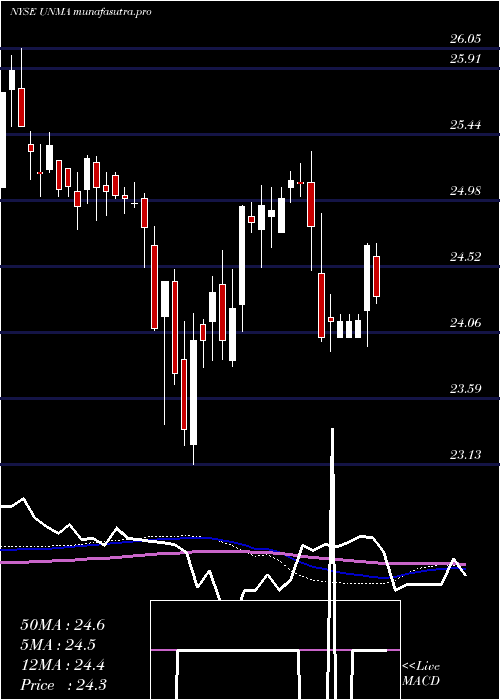
Monthly price and charts UnumGroup Strong monthly Stock price targets for UnumGroup UNMA are 23.54 and 24.08 | Monthly Target 1 | 23.11 | | Monthly Target 2 | 23.42 | | Monthly Target 3 | 23.653333333333 | | Monthly Target 4 | 23.96 | | Monthly Target 5 | 24.19 |
Monthly price and volumes Unum Group
| Date |
Closing |
Open |
Range |
Volume |
Fri 05 December 2025 |
23.72 (-0.5%) |
23.55 |
23.35 - 23.89 |
0.5496 times |
Fri 28 November 2025 |
23.84 (0.46%) |
23.65 |
23.47 - 23.94 |
0.6733 times |
Fri 31 October 2025 |
23.73 (-1.41%) |
24.11 |
23.65 - 24.49 |
0.7737 times |
Tue 30 September 2025 |
24.07 (2.21%) |
23.65 |
23.43 - 24.70 |
0.692 times |
Fri 29 August 2025 |
23.55 (0.38%) |
23.32 |
23.32 - 24.31 |
0.87 times |
Thu 31 July 2025 |
23.46 (2.58%) |
22.91 |
22.84 - 23.64 |
1.5304 times |
Mon 30 June 2025 |
22.87 (-6.35%) |
24.22 |
22.70 - 24.38 |
1.5489 times |
Fri 30 May 2025 |
24.42 (-0.29%) |
24.40 |
23.90 - 24.69 |
0.7362 times |
Wed 30 April 2025 |
24.49 (-2.78%) |
25.10 |
23.92 - 25.15 |
0.7534 times |
Mon 31 March 2025 |
25.19 (0.96%) |
24.87 |
24.65 - 25.33 |
1.8725 times |
Fri 28 February 2025 |
24.95 (3.96%) |
23.86 |
23.82 - 25.09 |
0.867 times |
DMA SMA EMA moving averages of Unum Group UNMA
DMA (daily moving average) of Unum Group UNMA
| DMA period | DMA value | | 5 day DMA | 23.66 | | 12 day DMA | 23.72 | | 20 day DMA | 23.74 | | 35 day DMA | 23.87 | | 50 day DMA | 23.96 | | 100 day DMA | 23.92 | | 150 day DMA | 23.92 | | 200 day DMA | 24.12 | EMA (exponential moving average) of Unum Group UNMA
| EMA period | EMA current | EMA prev | EMA prev2 | | 5 day EMA | 23.7 | 23.69 | 23.71 | | 12 day EMA | 23.73 | 23.73 | 23.74 | | 20 day EMA | 23.77 | 23.78 | 23.79 | | 35 day EMA | 23.85 | 23.86 | 23.87 | | 50 day EMA | 23.97 | 23.98 | 23.99 |
SMA (simple moving average) of Unum Group UNMA
| SMA period | SMA current | SMA prev | SMA prev2 | | 5 day SMA | 23.66 | 23.68 | 23.71 | | 12 day SMA | 23.72 | 23.74 | 23.75 | | 20 day SMA | 23.74 | 23.74 | 23.74 | | 35 day SMA | 23.87 | 23.88 | 23.9 | | 50 day SMA | 23.96 | 23.98 | 23.99 | | 100 day SMA | 23.92 | 23.92 | 23.91 | | 150 day SMA | 23.92 | 23.92 | 23.92 | | 200 day SMA | 24.12 | 24.12 | 24.13 |
|
|
