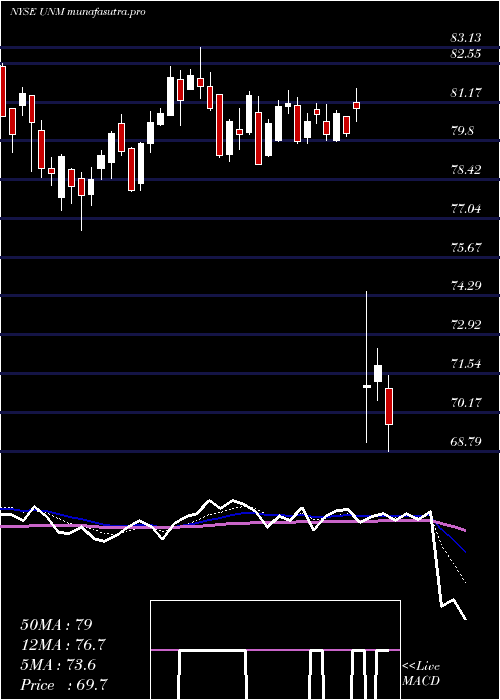
UnumGroup UNM full analysis,charts,indicators,moving averages,SMA,DMA,EMA,ADX,MACD,RSIUnum Group UNM WideScreen charts, DMA,SMA,EMA technical analysis, forecast prediction, by indicators ADX,MACD,RSI,CCI NYSE stock exchange
operates under Finance sector & deals in Accident Health Insurance
Daily price and charts and targets UnumGroup Strong Daily Stock price targets for UnumGroup UNM are 72.73 and 73.64 | Daily Target 1 | 72.53 | | Daily Target 2 | 72.93 | | Daily Target 3 | 73.436666666667 | | Daily Target 4 | 73.84 | | Daily Target 5 | 74.35 |
Daily price and volume Unum Group
| Date |
Closing |
Open |
Range |
Volume |
Thu 04 December 2025 |
73.34 (-0.29%) |
73.41 |
73.03 - 73.94 |
0.9882 times |
Wed 03 December 2025 |
73.55 (-1.01%) |
74.30 |
73.20 - 74.52 |
1.5049 times |
Tue 02 December 2025 |
74.30 (-1.2%) |
75.49 |
74.04 - 75.53 |
1.0111 times |
Mon 01 December 2025 |
75.20 (-1.01%) |
75.71 |
75.11 - 76.15 |
1.0001 times |
Fri 28 November 2025 |
75.97 (-0.54%) |
76.37 |
75.91 - 76.87 |
0.5446 times |
Wed 26 November 2025 |
76.38 (-0.22%) |
76.78 |
76.05 - 77.00 |
1.0262 times |
Tue 25 November 2025 |
76.55 (1.18%) |
76.23 |
75.85 - 77.30 |
0.9948 times |
Mon 24 November 2025 |
75.66 (0%) |
75.49 |
74.88 - 75.93 |
1.1645 times |
Fri 21 November 2025 |
75.66 (-0.83%) |
76.35 |
75.26 - 76.88 |
0.9333 times |
Thu 20 November 2025 |
76.29 (-0.27%) |
77.23 |
75.92 - 77.88 |
0.8322 times |
Wed 19 November 2025 |
76.50 (-0.29%) |
76.85 |
76.11 - 77.48 |
1.0375 times |
Weekly price and charts UnumGroup Strong weekly Stock price targets for UnumGroup UNM are 71.63 and 74.75 | Weekly Target 1 | 71.05 | | Weekly Target 2 | 72.2 | | Weekly Target 3 | 74.173333333333 | | Weekly Target 4 | 75.32 | | Weekly Target 5 | 77.29 |
Weekly price and volumes for Unum Group
| Date |
Closing |
Open |
Range |
Volume |
Thu 04 December 2025 |
73.34 (-3.46%) |
75.71 |
73.03 - 76.15 |
1.034 times |
Fri 28 November 2025 |
75.97 (0.41%) |
75.49 |
74.88 - 77.30 |
0.8562 times |
Fri 21 November 2025 |
75.66 (-1.7%) |
76.69 |
75.24 - 77.88 |
1.0931 times |
Fri 14 November 2025 |
76.97 (-1.51%) |
78.02 |
75.91 - 78.76 |
0.8422 times |
Fri 07 November 2025 |
78.15 (6.44%) |
74.45 |
74.45 - 78.99 |
1.8434 times |
Fri 31 October 2025 |
73.42 (0%) |
73.56 |
72.79 - 73.68 |
0.3163 times |
Fri 31 October 2025 |
73.42 (-3.5%) |
76.55 |
72.79 - 76.70 |
1.395 times |
Fri 24 October 2025 |
76.08 (0.82%) |
75.75 |
75.31 - 77.36 |
0.7971 times |
Fri 17 October 2025 |
75.46 (-0.51%) |
76.32 |
73.60 - 77.06 |
0.9412 times |
Fri 10 October 2025 |
75.85 (-4.5%) |
79.57 |
75.70 - 79.93 |
0.8815 times |
Fri 03 October 2025 |
79.42 (1.48%) |
78.46 |
76.87 - 79.74 |
0.7912 times |

Monthly price and charts UnumGroup Strong monthly Stock price targets for UnumGroup UNM are 71.63 and 74.75 | Monthly Target 1 | 71.05 | | Monthly Target 2 | 72.2 | | Monthly Target 3 | 74.173333333333 | | Monthly Target 4 | 75.32 | | Monthly Target 5 | 77.29 |
Monthly price and volumes Unum Group
| Date |
Closing |
Open |
Range |
Volume |
Thu 04 December 2025 |
73.34 (-3.46%) |
75.71 |
73.03 - 76.15 |
0.2073 times |
Fri 28 November 2025 |
75.97 (3.47%) |
74.45 |
74.45 - 78.99 |
0.9293 times |
Fri 31 October 2025 |
73.42 (-5.61%) |
77.36 |
72.79 - 79.93 |
0.9587 times |
Tue 30 September 2025 |
77.78 (11.34%) |
69.46 |
68.70 - 78.46 |
1.2855 times |
Fri 29 August 2025 |
69.86 (-2.72%) |
71.00 |
68.28 - 71.46 |
0.9564 times |
Thu 31 July 2025 |
71.81 (-11.08%) |
80.71 |
69.09 - 83.13 |
1.2399 times |
Mon 30 June 2025 |
80.76 (-1.16%) |
81.56 |
76.61 - 83.07 |
0.9179 times |
Fri 30 May 2025 |
81.71 (5.22%) |
77.01 |
77.01 - 82.52 |
0.7499 times |
Wed 30 April 2025 |
77.66 (-4.66%) |
81.39 |
66.81 - 83.21 |
1.3391 times |
Mon 31 March 2025 |
81.46 (-1.01%) |
82.21 |
76.24 - 84.04 |
1.4161 times |
Fri 28 February 2025 |
82.29 (7.92%) |
75.00 |
73.66 - 83.96 |
0.9334 times |

DMA SMA EMA moving averages of Unum Group UNM
DMA (daily moving average) of Unum Group UNM
| DMA period | DMA value | | 5 day DMA | 74.47 | | 12 day DMA | 75.51 | | 20 day DMA | 76.1 | | 35 day DMA | 75.79 | | 50 day DMA | 76.31 | | 100 day DMA | 74.93 | | 150 day DMA | 76.71 | | 200 day DMA | 77.03 | EMA (exponential moving average) of Unum Group UNM
| EMA period | EMA current | EMA prev | EMA prev2 | | 5 day EMA | 74.27 | 74.74 | 75.33 | | 12 day EMA | 75.14 | 75.47 | 75.82 | | 20 day EMA | 75.55 | 75.78 | 76.01 | | 35 day EMA | 75.97 | 76.12 | 76.27 | | 50 day EMA | 76.13 | 76.24 | 76.35 |
SMA (simple moving average) of Unum Group UNM
| SMA period | SMA current | SMA prev | SMA prev2 | | 5 day SMA | 74.47 | 75.08 | 75.68 | | 12 day SMA | 75.51 | 75.73 | 76.01 | | 20 day SMA | 76.1 | 76.27 | 76.5 | | 35 day SMA | 75.79 | 75.87 | 75.95 | | 50 day SMA | 76.31 | 76.38 | 76.44 | | 100 day SMA | 74.93 | 74.98 | 75.06 | | 150 day SMA | 76.71 | 76.74 | 76.78 | | 200 day SMA | 77.03 | 77.03 | 77.04 |
|
|
