UnitedhealthGroup UNH full analysis,charts,indicators,moving averages,SMA,DMA,EMA,ADX,MACD,RSIUnitedhealth Group UNH WideScreen charts, DMA,SMA,EMA technical analysis, forecast prediction, by indicators ADX,MACD,RSI,CCI NYSE stock exchange
operates under Health Care sector & deals in Medical Specialities
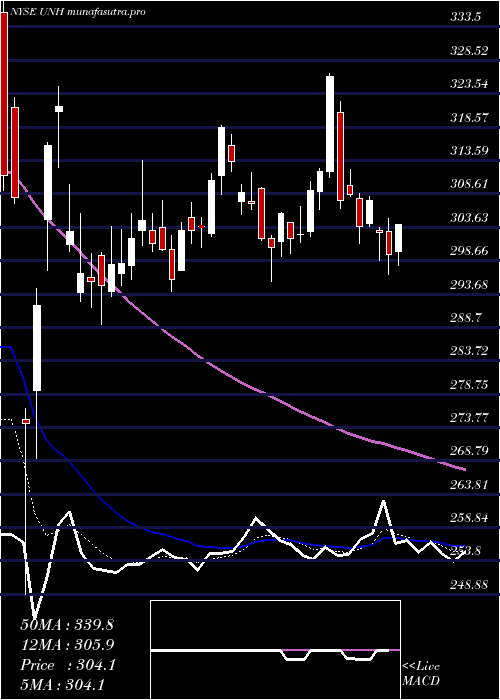
Daily price and charts and targets UnitedhealthGroup Strong Daily Stock price targets for UnitedhealthGroup UNH are 360.23 and 369.8 | Daily Target 1 | 352.44 | | Daily Target 2 | 358.44 | | Daily Target 3 | 362.00666666667 | | Daily Target 4 | 368.01 | | Daily Target 5 | 371.58 |
Daily price and volume Unitedhealth Group
| Date |
Closing |
Open |
Range |
Volume |
Mon 20 October 2025 |
364.45 (2.66%) |
357.53 |
356.00 - 365.57 |
0.4308 times |
Fri 17 October 2025 |
355.00 (0.21%) |
349.20 |
343.00 - 358.39 |
0.5648 times |
Thu 16 October 2025 |
354.25 (-1.91%) |
360.97 |
354.00 - 362.69 |
0.562 times |
Wed 15 October 2025 |
361.15 (0.34%) |
359.39 |
355.85 - 364.22 |
0.9781 times |
Tue 14 October 2025 |
359.93 (0.35%) |
354.95 |
353.40 - 362.33 |
0.8882 times |
Mon 13 October 2025 |
358.66 (1.17%) |
354.74 |
353.32 - 359.16 |
0.8413 times |
Fri 10 October 2025 |
354.50 (-3.59%) |
369.40 |
352.51 - 369.40 |
1.9537 times |
Thu 09 October 2025 |
367.69 (-0.6%) |
372.52 |
366.08 - 376.22 |
1.3022 times |
Wed 08 October 2025 |
369.92 (1.72%) |
366.93 |
365.80 - 374.63 |
1.4031 times |
Tue 07 October 2025 |
363.66 (1.16%) |
359.41 |
358.06 - 364.72 |
1.0757 times |
Mon 06 October 2025 |
359.49 (-0.35%) |
361.18 |
357.11 - 363.62 |
0.6881 times |
Weekly price and charts UnitedhealthGroup Strong weekly Stock price targets for UnitedhealthGroup UNH are 360.23 and 369.8 | Weekly Target 1 | 352.44 | | Weekly Target 2 | 358.44 | | Weekly Target 3 | 362.00666666667 | | Weekly Target 4 | 368.01 | | Weekly Target 5 | 371.58 |
Weekly price and volumes for Unitedhealth Group
| Date |
Closing |
Open |
Range |
Volume |
Mon 20 October 2025 |
364.45 (2.66%) |
357.53 |
356.00 - 365.57 |
0.0658 times |
Fri 17 October 2025 |
355.00 (0.14%) |
354.74 |
343.00 - 364.22 |
0.5858 times |
Fri 10 October 2025 |
354.50 (-1.73%) |
361.18 |
352.51 - 376.22 |
0.9812 times |
Fri 03 October 2025 |
360.74 (4.84%) |
343.98 |
341.45 - 368.00 |
0.8532 times |
Fri 26 September 2025 |
344.08 (2.19%) |
334.46 |
332.60 - 354.50 |
1.0282 times |
Fri 19 September 2025 |
336.69 (-4.49%) |
351.26 |
333.84 - 351.71 |
1.296 times |
Fri 12 September 2025 |
352.51 (11.77%) |
319.71 |
313.80 - 362.31 |
2.6244 times |
Fri 05 September 2025 |
315.39 (1.78%) |
308.30 |
303.70 - 317.94 |
0.964 times |
Fri 29 August 2025 |
309.87 (0%) |
302.30 |
300.91 - 310.00 |
0.2738 times |
Fri 29 August 2025 |
309.87 (0.8%) |
308.49 |
294.20 - 310.00 |
1.3276 times |
Fri 22 August 2025 |
307.42 (1.12%) |
313.17 |
295.70 - 316.40 |
2.4258 times |
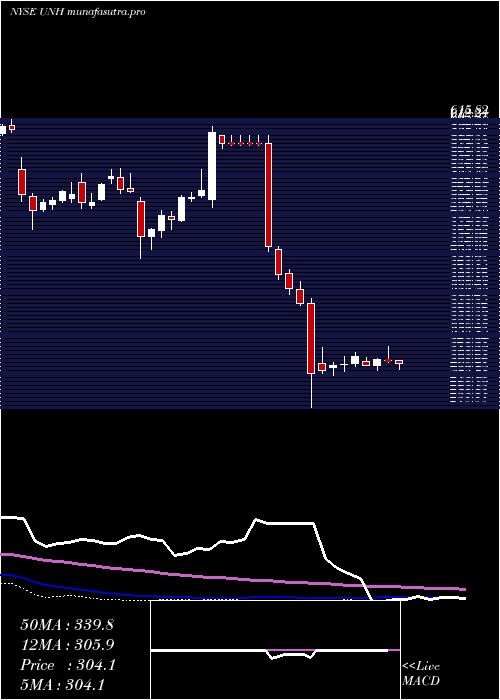
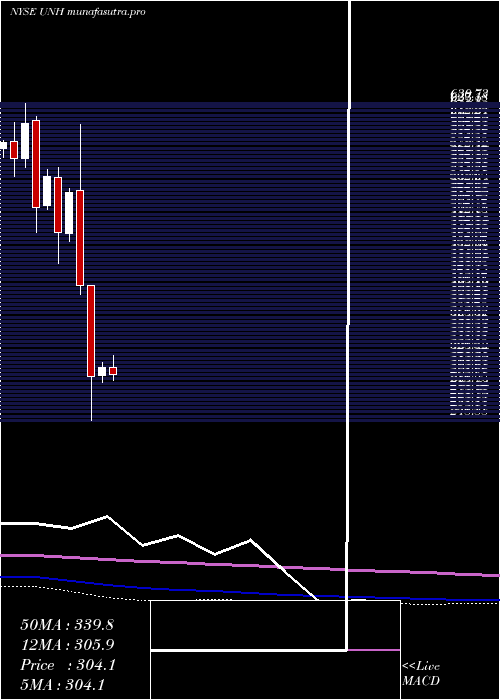
Monthly price and charts UnitedhealthGroup Strong monthly Stock price targets for UnitedhealthGroup UNH are 353.04 and 387.63 | Monthly Target 1 | 326.18 | | Monthly Target 2 | 345.31 | | Monthly Target 3 | 360.76666666667 | | Monthly Target 4 | 379.9 | | Monthly Target 5 | 395.36 |
Monthly price and volumes Unitedhealth Group
| Date |
Closing |
Open |
Range |
Volume |
Mon 20 October 2025 |
364.45 (5.55%) |
343.90 |
341.63 - 376.22 |
0.3881 times |
Tue 30 September 2025 |
345.30 (11.43%) |
308.30 |
303.70 - 362.31 |
1.12 times |
Fri 29 August 2025 |
309.87 (24.17%) |
250.61 |
234.60 - 316.40 |
1.6787 times |
Thu 31 July 2025 |
249.56 (-20.01%) |
311.97 |
247.75 - 326.55 |
1.4153 times |
Mon 30 June 2025 |
311.97 (3.33%) |
303.12 |
294.11 - 318.80 |
0.9746 times |
Fri 30 May 2025 |
301.91 (-26.62%) |
411.32 |
248.88 - 411.99 |
2.5557 times |
Wed 30 April 2025 |
411.44 (-21.44%) |
525.74 |
401.00 - 606.36 |
0.6755 times |
Mon 31 March 2025 |
523.75 (10.27%) |
474.37 |
465.21 - 528.12 |
0.3521 times |
Fri 28 February 2025 |
474.96 (-12.45%) |
542.00 |
438.50 - 553.91 |
0.4228 times |
Fri 31 January 2025 |
542.49 (7.24%) |
508.00 |
502.80 - 551.91 |
0.4173 times |
Tue 31 December 2024 |
505.86 (-16.63%) |
611.02 |
475.82 - 615.82 |
0.4619 times |
DMA SMA EMA moving averages of Unitedhealth Group UNH
DMA (daily moving average) of Unitedhealth Group UNH
| DMA period | DMA value | | 5 day DMA | 358.96 | | 12 day DMA | 360.79 | | 20 day DMA | 355.53 | | 35 day DMA | 346.18 | | 50 day DMA | 331.59 | | 100 day DMA | 311.59 | | 150 day DMA | 359.65 | | 200 day DMA | 397.44 | EMA (exponential moving average) of Unitedhealth Group UNH
| EMA period | EMA current | EMA prev | EMA prev2 | | 5 day EMA | 359.64 | 357.23 | 358.34 | | 12 day EMA | 357.93 | 356.75 | 357.07 | | 20 day EMA | 353.55 | 352.4 | 352.13 | | 35 day EMA | 340.83 | 339.44 | 338.52 | | 50 day EMA | 327.55 | 326.04 | 324.86 |
SMA (simple moving average) of Unitedhealth Group UNH
| SMA period | SMA current | SMA prev | SMA prev2 | | 5 day SMA | 358.96 | 357.8 | 357.7 | | 12 day SMA | 360.79 | 359.86 | 359.3 | | 20 day SMA | 355.53 | 354.37 | 353.46 | | 35 day SMA | 346.18 | 344.62 | 343.33 | | 50 day SMA | 331.59 | 329.35 | 327.27 | | 100 day SMA | 311.59 | 310.9 | 310.3 | | 150 day SMA | 359.65 | 360.58 | 361.54 | | 200 day SMA | 397.44 | 398.18 | 398.97 |
|
|
