UnileverPlc UL full analysis,charts,indicators,moving averages,SMA,DMA,EMA,ADX,MACD,RSIUnilever Plc UL WideScreen charts, DMA,SMA,EMA technical analysis, forecast prediction, by indicators ADX,MACD,RSI,CCI NYSE stock exchange
operates under Basic Industries sector & deals in Package Goods Cosmetics
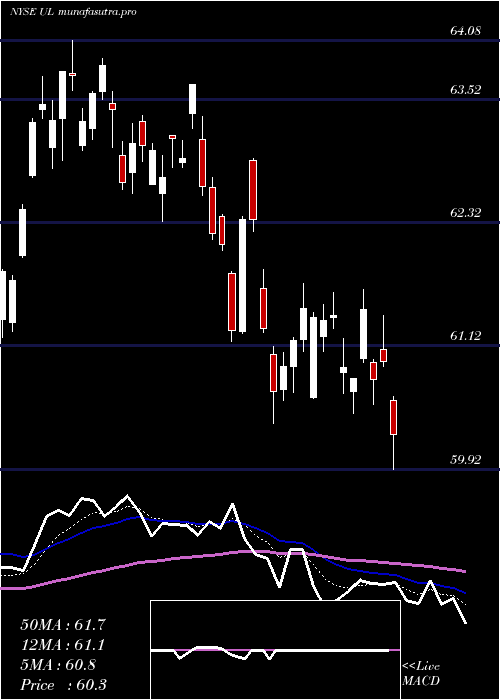
Daily price and charts and targets UnileverPlc Strong Daily Stock price targets for UnileverPlc UL are 59.22 and 59.81 | Daily Target 1 | 58.74 | | Daily Target 2 | 59.11 | | Daily Target 3 | 59.33 | | Daily Target 4 | 59.7 | | Daily Target 5 | 59.92 |
Daily price and volume Unilever Plc
| Date |
Closing |
Open |
Range |
Volume |
Fri 05 December 2025 |
59.48 (0.63%) |
59.03 |
58.96 - 59.55 |
1.2524 times |
Thu 04 December 2025 |
59.11 (-0.42%) |
59.52 |
59.03 - 59.67 |
0.8678 times |
Wed 03 December 2025 |
59.36 (-0.34%) |
59.60 |
59.27 - 60.10 |
0.8625 times |
Tue 02 December 2025 |
59.56 (-1.31%) |
60.45 |
58.98 - 60.56 |
1.0548 times |
Mon 01 December 2025 |
60.35 (-0.4%) |
61.04 |
60.29 - 61.11 |
1.1945 times |
Fri 28 November 2025 |
60.59 (0.65%) |
60.27 |
60.24 - 60.73 |
1.3188 times |
Wed 26 November 2025 |
60.20 (-0.05%) |
60.23 |
60.01 - 60.28 |
0.6965 times |
Tue 25 November 2025 |
60.23 (1.06%) |
59.98 |
59.96 - 60.51 |
0.7389 times |
Mon 24 November 2025 |
59.60 (-1.32%) |
60.13 |
59.50 - 60.18 |
0.8741 times |
Fri 21 November 2025 |
60.40 (1.89%) |
59.76 |
59.68 - 60.53 |
1.1397 times |
Thu 20 November 2025 |
59.28 (0.7%) |
58.97 |
58.80 - 59.38 |
1.0638 times |
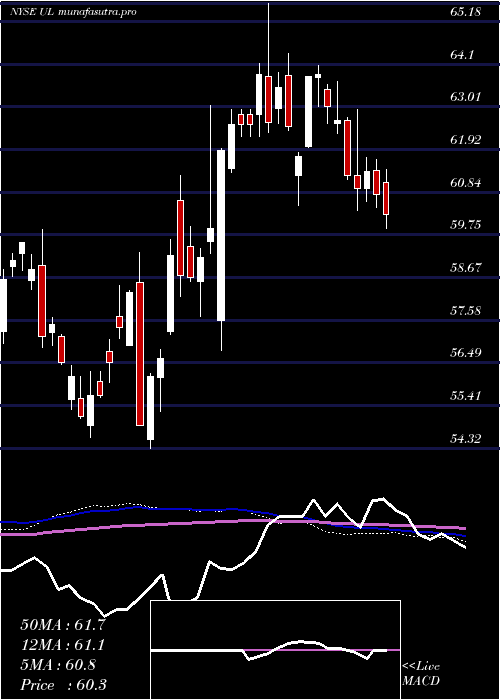
Weekly price and charts UnileverPlc Strong weekly Stock price targets for UnileverPlc UL are 58.15 and 60.3 | Weekly Target 1 | 57.7 | | Weekly Target 2 | 58.59 | | Weekly Target 3 | 59.85 | | Weekly Target 4 | 60.74 | | Weekly Target 5 | 62 |
Weekly price and volumes for Unilever Plc
| Date |
Closing |
Open |
Range |
Volume |
Fri 05 December 2025 |
59.48 (-1.83%) |
61.04 |
58.96 - 61.11 |
1.1842 times |
Fri 28 November 2025 |
60.59 (0.31%) |
60.13 |
59.50 - 60.73 |
0.8212 times |
Fri 21 November 2025 |
60.40 (1.96%) |
59.36 |
58.80 - 60.53 |
0.9928 times |
Fri 14 November 2025 |
59.24 (-3.63%) |
61.00 |
59.18 - 61.38 |
0.9324 times |
Fri 07 November 2025 |
61.47 (2.13%) |
60.48 |
60.31 - 61.58 |
0.9051 times |
Fri 31 October 2025 |
60.19 (0%) |
60.42 |
60.16 - 60.66 |
0.2186 times |
Fri 31 October 2025 |
60.19 (-3.96%) |
62.49 |
60.16 - 62.72 |
1.1022 times |
Fri 24 October 2025 |
62.67 (-0.71%) |
62.68 |
61.80 - 63.40 |
1.1895 times |
Fri 17 October 2025 |
63.12 (4.45%) |
59.71 |
59.61 - 63.30 |
1.7046 times |
Fri 10 October 2025 |
60.43 (2.32%) |
58.83 |
58.24 - 60.50 |
0.9494 times |
Fri 03 October 2025 |
59.06 (-0.37%) |
59.00 |
58.67 - 59.69 |
0.7275 times |
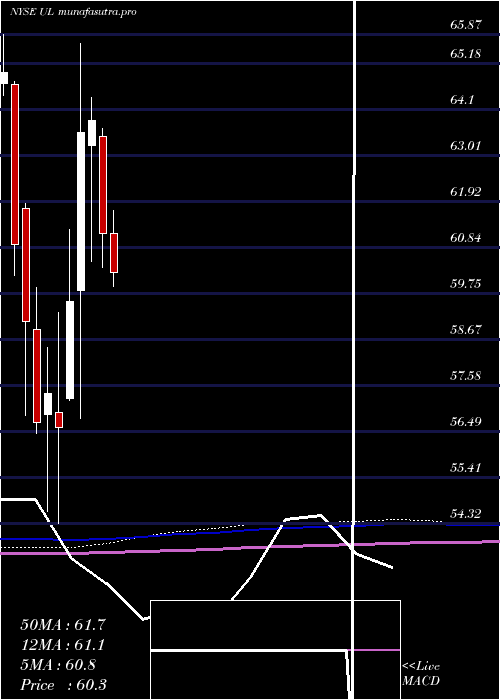
Monthly price and charts UnileverPlc Strong monthly Stock price targets for UnileverPlc UL are 58.15 and 60.3 | Monthly Target 1 | 57.7 | | Monthly Target 2 | 58.59 | | Monthly Target 3 | 59.85 | | Monthly Target 4 | 60.74 | | Monthly Target 5 | 62 |
Monthly price and volumes Unilever Plc
| Date |
Closing |
Open |
Range |
Volume |
Fri 05 December 2025 |
59.48 (-1.83%) |
61.04 |
58.96 - 61.11 |
0.3395 times |
Fri 28 November 2025 |
60.59 (0.66%) |
60.48 |
58.80 - 61.58 |
1.0469 times |
Fri 31 October 2025 |
60.19 (1.54%) |
59.62 |
58.24 - 63.40 |
1.5959 times |
Tue 30 September 2025 |
59.28 (-6.2%) |
63.50 |
58.71 - 65.01 |
1.0114 times |
Fri 29 August 2025 |
63.20 (8.16%) |
60.23 |
59.85 - 63.70 |
0.9614 times |
Thu 31 July 2025 |
58.43 (-4.48%) |
61.18 |
58.16 - 61.72 |
0.955 times |
Mon 30 June 2025 |
61.17 (-4.18%) |
63.47 |
60.37 - 63.65 |
0.8347 times |
Fri 30 May 2025 |
63.84 (0.46%) |
63.26 |
60.51 - 64.38 |
0.8547 times |
Wed 30 April 2025 |
63.55 (6.72%) |
59.82 |
56.80 - 65.66 |
1.4562 times |
Mon 31 March 2025 |
59.55 (5.21%) |
57.28 |
57.22 - 61.26 |
0.9443 times |
Fri 28 February 2025 |
56.60 (-1.36%) |
56.93 |
54.32 - 59.30 |
1.0985 times |
DMA SMA EMA moving averages of Unilever Plc UL
DMA (daily moving average) of Unilever Plc UL
| DMA period | DMA value | | 5 day DMA | 59.57 | | 12 day DMA | 59.75 | | 20 day DMA | 59.98 | | 35 day DMA | 60.71 | | 50 day DMA | 60.37 | | 100 day DMA | 60.99 | | 150 day DMA | 61.41 | | 200 day DMA | 61.04 | EMA (exponential moving average) of Unilever Plc UL
| EMA period | EMA current | EMA prev | EMA prev2 | | 5 day EMA | 59.53 | 59.56 | 59.79 | | 12 day EMA | 59.78 | 59.83 | 59.96 | | 20 day EMA | 59.97 | 60.02 | 60.12 | | 35 day EMA | 60.1 | 60.14 | 60.2 | | 50 day EMA | 60.3 | 60.33 | 60.38 |
SMA (simple moving average) of Unilever Plc UL
| SMA period | SMA current | SMA prev | SMA prev2 | | 5 day SMA | 59.57 | 59.79 | 60.01 | | 12 day SMA | 59.75 | 59.75 | 59.75 | | 20 day SMA | 59.98 | 60.05 | 60.16 | | 35 day SMA | 60.71 | 60.78 | 60.84 | | 50 day SMA | 60.37 | 60.37 | 60.39 | | 100 day SMA | 60.99 | 61 | 61.01 | | 150 day SMA | 61.41 | 61.44 | 61.47 | | 200 day SMA | 61.04 | 61.02 | 61 |
|
|
