UberTechnologies UBER full analysis,charts,indicators,moving averages,SMA,DMA,EMA,ADX,MACD,RSIUber Technologies UBER WideScreen charts, DMA,SMA,EMA technical analysis, forecast prediction, by indicators ADX,MACD,RSI,CCI NYSE stock exchange
Daily price and charts and targets UberTechnologies Strong Daily Stock price targets for UberTechnologies UBER are 90.22 and 91.83 | Daily Target 1 | 88.89 | | Daily Target 2 | 89.93 | | Daily Target 3 | 90.496666666667 | | Daily Target 4 | 91.54 | | Daily Target 5 | 92.11 |
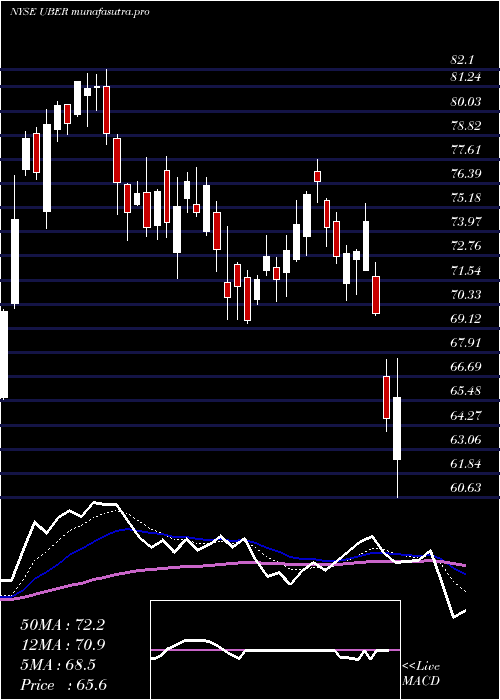
Daily price and volume Uber Technologies
| Date |
Closing |
Open |
Range |
Volume |
Thu 04 December 2025 |
90.98 (0.33%) |
90.84 |
89.45 - 91.06 |
0.4611 times |
Wed 03 December 2025 |
90.68 (3.54%) |
89.85 |
88.95 - 91.38 |
1.1896 times |
Tue 02 December 2025 |
87.58 (1.17%) |
86.75 |
85.63 - 88.44 |
0.5997 times |
Mon 01 December 2025 |
86.57 (-1.11%) |
86.99 |
85.48 - 87.61 |
0.9766 times |
Fri 28 November 2025 |
87.54 (2.14%) |
86.51 |
86.24 - 87.62 |
0.5057 times |
Wed 26 November 2025 |
85.71 (2.43%) |
84.45 |
83.65 - 86.36 |
0.7399 times |
Tue 25 November 2025 |
83.68 (0.04%) |
83.82 |
82.39 - 84.27 |
0.6217 times |
Mon 24 November 2025 |
83.65 (-0.26%) |
84.40 |
83.03 - 85.21 |
0.6973 times |
Fri 21 November 2025 |
83.87 (0.61%) |
83.97 |
81.51 - 84.00 |
1.8817 times |
Thu 20 November 2025 |
83.36 (-6.89%) |
90.20 |
82.94 - 90.54 |
2.3269 times |
Wed 19 November 2025 |
89.53 (-1.45%) |
90.60 |
88.89 - 91.08 |
1.0179 times |
Weekly price and charts UberTechnologies Strong weekly Stock price targets for UberTechnologies UBER are 88.23 and 94.13 | Weekly Target 1 | 83.38 | | Weekly Target 2 | 87.18 | | Weekly Target 3 | 89.28 | | Weekly Target 4 | 93.08 | | Weekly Target 5 | 95.18 |
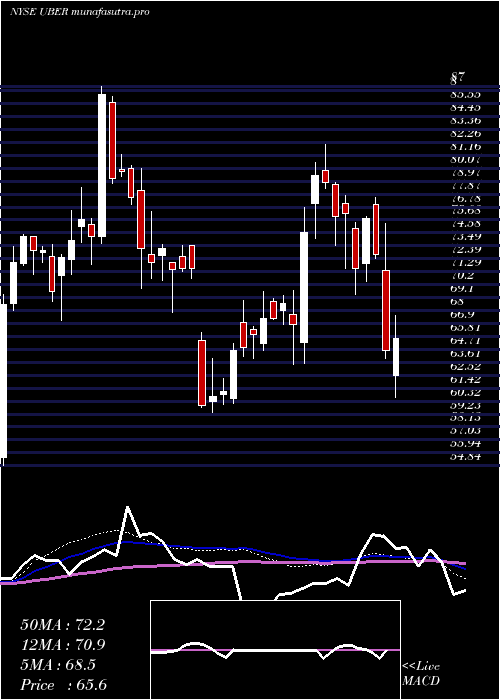
Weekly price and volumes for Uber Technologies
| Date |
Closing |
Open |
Range |
Volume |
Thu 04 December 2025 |
90.98 (3.93%) |
86.99 |
85.48 - 91.38 |
0.9293 times |
Fri 28 November 2025 |
87.54 (4.38%) |
84.40 |
82.39 - 87.62 |
0.7385 times |
Fri 21 November 2025 |
83.87 (-8.46%) |
91.31 |
81.51 - 92.92 |
1.9658 times |
Fri 14 November 2025 |
91.62 (-0.42%) |
92.99 |
89.62 - 95.18 |
0.944 times |
Fri 07 November 2025 |
92.01 (-4.65%) |
98.48 |
90.08 - 99.99 |
1.2318 times |
Fri 31 October 2025 |
96.50 (0%) |
97.46 |
96.15 - 98.45 |
0.2462 times |
Fri 31 October 2025 |
96.50 (2.57%) |
94.91 |
94.53 - 98.45 |
1.1608 times |
Fri 24 October 2025 |
94.08 (1.87%) |
92.94 |
91.42 - 95.70 |
0.6962 times |
Fri 17 October 2025 |
92.35 (-1.12%) |
95.00 |
90.55 - 96.99 |
0.9645 times |
Fri 10 October 2025 |
93.40 (-3.39%) |
96.99 |
93.33 - 101.30 |
1.1229 times |
Fri 03 October 2025 |
96.68 (-1.8%) |
99.32 |
94.76 - 100.26 |
1.1273 times |
Monthly price and charts UberTechnologies Strong monthly Stock price targets for UberTechnologies UBER are 88.23 and 94.13 | Monthly Target 1 | 83.38 | | Monthly Target 2 | 87.18 | | Monthly Target 3 | 89.28 | | Monthly Target 4 | 93.08 | | Monthly Target 5 | 95.18 |
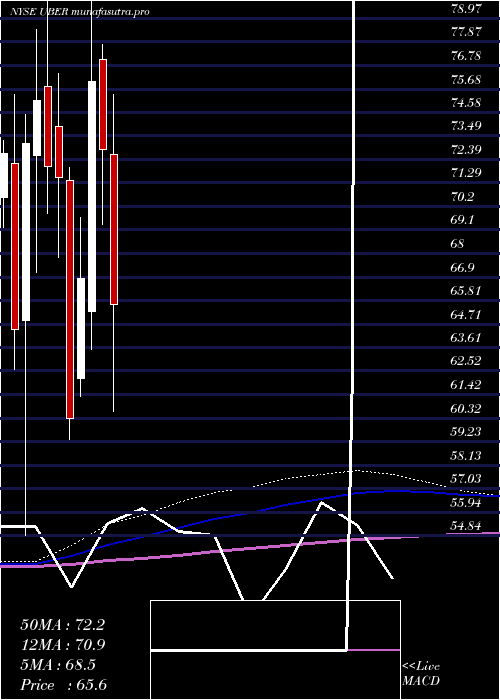
Monthly price and volumes Uber Technologies
| Date |
Closing |
Open |
Range |
Volume |
Thu 04 December 2025 |
90.98 (3.93%) |
86.99 |
85.48 - 91.38 |
0.1659 times |
Fri 28 November 2025 |
87.54 (-9.28%) |
98.48 |
81.51 - 99.99 |
0.8711 times |
Fri 31 October 2025 |
96.50 (-1.5%) |
97.47 |
90.55 - 101.30 |
0.8543 times |
Tue 30 September 2025 |
97.97 (4.5%) |
92.26 |
88.84 - 101.99 |
1.1228 times |
Fri 29 August 2025 |
93.75 (6.84%) |
86.50 |
85.42 - 97.54 |
1.1013 times |
Thu 31 July 2025 |
87.75 (-5.95%) |
92.85 |
86.36 - 97.71 |
1.042 times |
Mon 30 June 2025 |
93.30 (10.86%) |
84.48 |
81.86 - 94.38 |
1.2327 times |
Fri 30 May 2025 |
84.16 (3.89%) |
81.00 |
80.12 - 93.60 |
1.5374 times |
Wed 30 April 2025 |
81.01 (11.19%) |
72.60 |
60.63 - 81.22 |
1.1049 times |
Mon 31 March 2025 |
72.86 (-4.14%) |
77.06 |
69.36 - 77.74 |
0.9677 times |
Fri 28 February 2025 |
76.01 (13.7%) |
65.30 |
63.50 - 82.10 |
1.6365 times |
DMA SMA EMA moving averages of Uber Technologies UBER
DMA (daily moving average) of Uber Technologies UBER
| DMA period | DMA value | | 5 day DMA | 88.67 | | 12 day DMA | 87 | | 20 day DMA | 89.25 | | 35 day DMA | 91.48 | | 50 day DMA | 93.09 | | 100 day DMA | 93.05 | | 150 day DMA | 91.54 | | 200 day DMA | 87.16 | EMA (exponential moving average) of Uber Technologies UBER
| EMA period | EMA current | EMA prev | EMA prev2 | | 5 day EMA | 89 | 88.01 | 86.68 | | 12 day EMA | 88.47 | 88.01 | 87.53 | | 20 day EMA | 89.31 | 89.13 | 88.97 | | 35 day EMA | 91 | 91 | 91.02 | | 50 day EMA | 93.05 | 93.13 | 93.23 |
SMA (simple moving average) of Uber Technologies UBER
| SMA period | SMA current | SMA prev | SMA prev2 | | 5 day SMA | 88.67 | 87.62 | 86.22 | | 12 day SMA | 87 | 87.09 | 87.17 | | 20 day SMA | 89.25 | 89.34 | 89.54 | | 35 day SMA | 91.48 | 91.58 | 91.68 | | 50 day SMA | 93.09 | 93.23 | 93.37 | | 100 day SMA | 93.05 | 93.06 | 93.1 | | 150 day SMA | 91.54 | 91.47 | 91.4 | | 200 day SMA | 87.16 | 87.11 | 87.06 |
|
|
