UnderArmour UAA full analysis,charts,indicators,moving averages,SMA,DMA,EMA,ADX,MACD,RSIUnder Armour UAA WideScreen charts, DMA,SMA,EMA technical analysis, forecast prediction, by indicators ADX,MACD,RSI,CCI NYSE stock exchange
operates under Consumer Non Durables sector & deals in Apparel
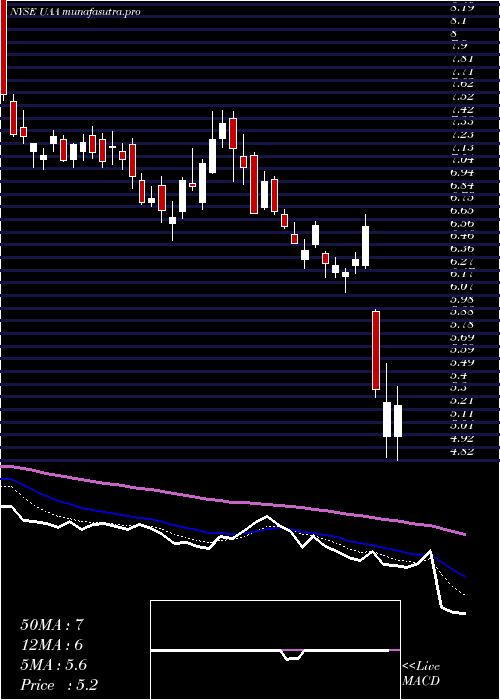
Daily price and charts and targets UnderArmour Strong Daily Stock price targets for UnderArmour UAA are 4.52 and 4.61 | Daily Target 1 | 4.45 | | Daily Target 2 | 4.5 | | Daily Target 3 | 4.54 | | Daily Target 4 | 4.59 | | Daily Target 5 | 4.63 |
Daily price and volume Under Armour
| Date |
Closing |
Open |
Range |
Volume |
Fri 05 December 2025 |
4.55 (0.44%) |
4.54 |
4.49 - 4.58 |
0.701 times |
Thu 04 December 2025 |
4.53 (-2.37%) |
4.61 |
4.51 - 4.67 |
0.982 times |
Wed 03 December 2025 |
4.64 (1.75%) |
4.60 |
4.55 - 4.70 |
0.8613 times |
Tue 02 December 2025 |
4.56 (-0.44%) |
4.62 |
4.51 - 4.63 |
0.919 times |
Mon 01 December 2025 |
4.58 (-0.87%) |
4.57 |
4.53 - 4.70 |
1.1509 times |
Fri 28 November 2025 |
4.62 (0%) |
4.63 |
4.60 - 4.66 |
0.5207 times |
Wed 26 November 2025 |
4.62 (2.9%) |
4.56 |
4.44 - 4.69 |
0.8405 times |
Tue 25 November 2025 |
4.49 (2.05%) |
4.38 |
4.37 - 4.59 |
1.1193 times |
Mon 24 November 2025 |
4.40 (2.8%) |
4.34 |
4.23 - 4.44 |
1.2256 times |
Fri 21 November 2025 |
4.28 (2.64%) |
4.19 |
4.18 - 4.36 |
1.6797 times |
Thu 20 November 2025 |
4.17 (-1.42%) |
4.25 |
4.13 - 4.31 |
1.3927 times |
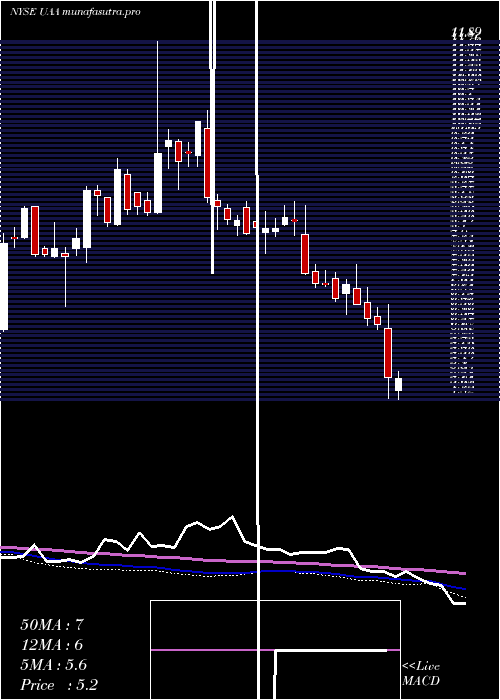
Weekly price and charts UnderArmour Strong weekly Stock price targets for UnderArmour UAA are 4.42 and 4.63 | Weekly Target 1 | 4.37 | | Weekly Target 2 | 4.46 | | Weekly Target 3 | 4.58 | | Weekly Target 4 | 4.67 | | Weekly Target 5 | 4.79 |
Weekly price and volumes for Under Armour
| Date |
Closing |
Open |
Range |
Volume |
Fri 05 December 2025 |
4.55 (-1.52%) |
4.57 |
4.49 - 4.70 |
0.8459 times |
Fri 28 November 2025 |
4.62 (7.94%) |
4.34 |
4.23 - 4.69 |
0.6794 times |
Fri 21 November 2025 |
4.28 (-5.52%) |
4.50 |
4.13 - 4.50 |
1.3672 times |
Fri 14 November 2025 |
4.53 (-3%) |
4.69 |
4.43 - 4.86 |
1.3035 times |
Fri 07 November 2025 |
4.67 (1.3%) |
4.54 |
4.35 - 4.69 |
1.4771 times |
Fri 31 October 2025 |
4.61 (0%) |
4.50 |
4.45 - 4.62 |
0.2988 times |
Fri 31 October 2025 |
4.61 (-3.96%) |
4.86 |
4.45 - 4.94 |
1.4903 times |
Fri 24 October 2025 |
4.80 (0.42%) |
4.82 |
4.72 - 4.91 |
1.0255 times |
Fri 17 October 2025 |
4.78 (-1.44%) |
4.78 |
4.74 - 4.96 |
1.0814 times |
Tue 07 October 2025 |
4.85 (-4.15%) |
5.10 |
4.84 - 5.10 |
0.4308 times |
Fri 03 October 2025 |
5.06 (1.81%) |
5.02 |
4.90 - 5.15 |
1.2463 times |
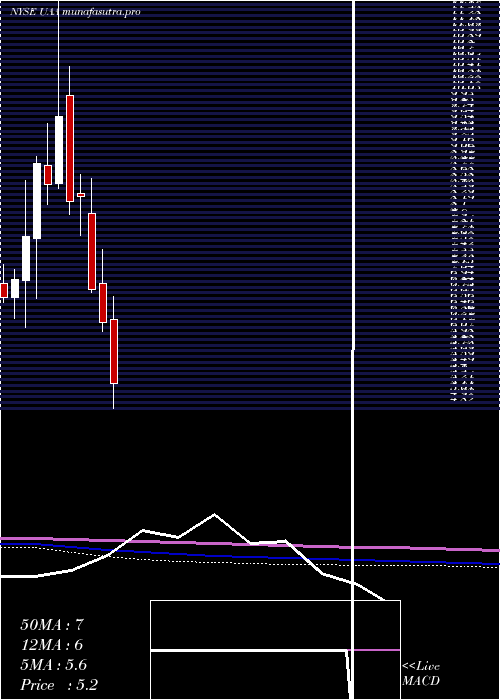
Monthly price and charts UnderArmour Strong monthly Stock price targets for UnderArmour UAA are 4.42 and 4.63 | Monthly Target 1 | 4.37 | | Monthly Target 2 | 4.46 | | Monthly Target 3 | 4.58 | | Monthly Target 4 | 4.67 | | Monthly Target 5 | 4.79 |
Monthly price and volumes Under Armour
| Date |
Closing |
Open |
Range |
Volume |
Fri 05 December 2025 |
4.55 (-1.52%) |
4.57 |
4.49 - 4.70 |
0.1291 times |
Fri 28 November 2025 |
4.62 (0.22%) |
4.54 |
4.13 - 4.86 |
0.7369 times |
Fri 31 October 2025 |
4.61 (-7.62%) |
5.01 |
4.45 - 5.15 |
0.7763 times |
Tue 30 September 2025 |
4.99 (-0.2%) |
4.95 |
4.72 - 5.31 |
1.0442 times |
Fri 29 August 2025 |
5.00 (-24.7%) |
6.53 |
4.85 - 6.86 |
1.5566 times |
Thu 31 July 2025 |
6.64 (-2.78%) |
6.82 |
6.59 - 7.57 |
0.9134 times |
Mon 30 June 2025 |
6.83 (1.79%) |
6.68 |
6.15 - 7.17 |
0.7328 times |
Fri 30 May 2025 |
6.71 (17.31%) |
5.73 |
5.61 - 7.01 |
1.4054 times |
Wed 30 April 2025 |
5.72 (-8.48%) |
6.30 |
4.78 - 6.69 |
1.5166 times |
Mon 31 March 2025 |
6.25 (-8.22%) |
6.91 |
6.10 - 7.48 |
1.1889 times |
Fri 28 February 2025 |
6.81 (-18.44%) |
8.07 |
6.75 - 8.65 |
0.9354 times |
DMA SMA EMA moving averages of Under Armour UAA
DMA (daily moving average) of Under Armour UAA
| DMA period | DMA value | | 5 day DMA | 4.57 | | 12 day DMA | 4.47 | | 20 day DMA | 4.5 | | 35 day DMA | 4.58 | | 50 day DMA | 4.68 | | 100 day DMA | 5.19 | | 150 day DMA | 5.65 | | 200 day DMA | 5.83 | EMA (exponential moving average) of Under Armour UAA
| EMA period | EMA current | EMA prev | EMA prev2 | | 5 day EMA | 4.56 | 4.56 | 4.57 | | 12 day EMA | 4.53 | 4.53 | 4.53 | | 20 day EMA | 4.53 | 4.53 | 4.53 | | 35 day EMA | 4.59 | 4.59 | 4.59 | | 50 day EMA | 4.67 | 4.68 | 4.69 |
SMA (simple moving average) of Under Armour UAA
| SMA period | SMA current | SMA prev | SMA prev2 | | 5 day SMA | 4.57 | 4.59 | 4.6 | | 12 day SMA | 4.47 | 4.45 | 4.43 | | 20 day SMA | 4.5 | 4.5 | 4.5 | | 35 day SMA | 4.58 | 4.59 | 4.59 | | 50 day SMA | 4.68 | 4.68 | 4.69 | | 100 day SMA | 5.19 | 5.22 | 5.24 | | 150 day SMA | 5.65 | 5.66 | 5.67 | | 200 day SMA | 5.83 | 5.84 | 5.85 |
|
|
