TylerTechnologies TYL full analysis,charts,indicators,moving averages,SMA,DMA,EMA,ADX,MACD,RSITyler Technologies TYL WideScreen charts, DMA,SMA,EMA technical analysis, forecast prediction, by indicators ADX,MACD,RSI,CCI NYSE stock exchange
operates under Technology sector & deals in Computer Software Prepackaged Software
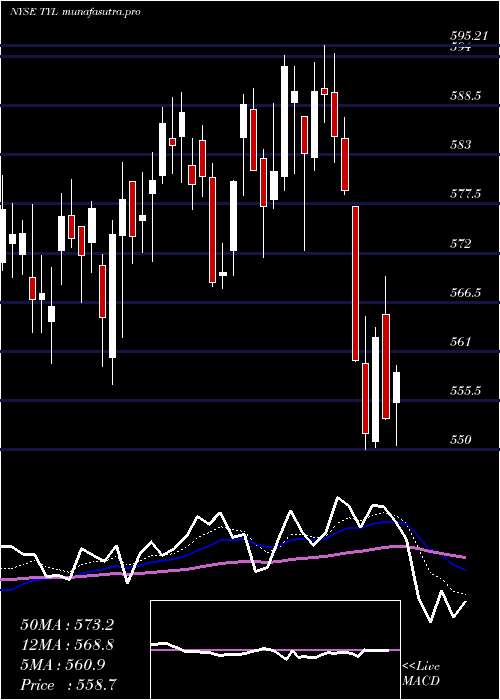
Daily price and charts and targets TylerTechnologies Strong Daily Stock price targets for TylerTechnologies TYL are 507.45 and 517.34 | Daily Target 1 | 499.92 | | Daily Target 2 | 505.08 | | Daily Target 3 | 509.80666666667 | | Daily Target 4 | 514.97 | | Daily Target 5 | 519.7 |
Daily price and volume Tyler Technologies
| Date |
Closing |
Open |
Range |
Volume |
Mon 20 October 2025 |
510.25 (0.92%) |
504.64 |
504.64 - 514.53 |
0.6374 times |
Fri 17 October 2025 |
505.60 (1.82%) |
496.06 |
496.06 - 506.55 |
0.7209 times |
Thu 16 October 2025 |
496.54 (-1.1%) |
498.94 |
495.53 - 505.69 |
0.6505 times |
Wed 15 October 2025 |
502.05 (-0.84%) |
505.09 |
499.92 - 507.25 |
0.7846 times |
Tue 14 October 2025 |
506.28 (-0.05%) |
503.64 |
500.39 - 507.75 |
0.7635 times |
Mon 13 October 2025 |
506.53 (0.46%) |
502.09 |
496.94 - 511.95 |
1.1295 times |
Fri 10 October 2025 |
504.21 (-0.44%) |
504.05 |
499.90 - 509.65 |
0.9216 times |
Thu 09 October 2025 |
506.46 (-2.15%) |
516.90 |
505.12 - 517.67 |
1.2756 times |
Wed 08 October 2025 |
517.57 (6.56%) |
497.13 |
489.44 - 519.79 |
2.0436 times |
Tue 07 October 2025 |
485.73 (-2.12%) |
496.03 |
483.56 - 496.72 |
1.0729 times |
Mon 06 October 2025 |
496.23 (-1.29%) |
504.48 |
495.30 - 504.48 |
0.392 times |
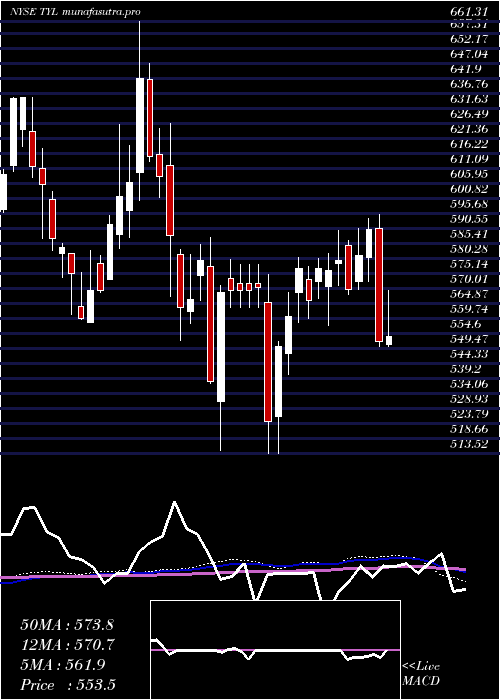
Weekly price and charts TylerTechnologies Strong weekly Stock price targets for TylerTechnologies TYL are 507.45 and 517.34 | Weekly Target 1 | 499.92 | | Weekly Target 2 | 505.08 | | Weekly Target 3 | 509.80666666667 | | Weekly Target 4 | 514.97 | | Weekly Target 5 | 519.7 |
Weekly price and volumes for Tyler Technologies
| Date |
Closing |
Open |
Range |
Volume |
Mon 20 October 2025 |
510.25 (0.92%) |
504.64 |
504.64 - 514.53 |
0.1675 times |
Fri 17 October 2025 |
505.60 (0.28%) |
502.09 |
495.53 - 511.95 |
1.0643 times |
Fri 10 October 2025 |
504.21 (0.29%) |
504.48 |
483.56 - 519.79 |
1.4997 times |
Fri 03 October 2025 |
502.74 (-5.09%) |
530.59 |
494.32 - 531.94 |
1.2826 times |
Fri 26 September 2025 |
529.72 (-0.86%) |
531.80 |
516.77 - 538.90 |
1.123 times |
Fri 19 September 2025 |
534.32 (-1.96%) |
544.99 |
528.09 - 547.93 |
1.7312 times |
Fri 12 September 2025 |
544.99 (-2.67%) |
559.96 |
543.68 - 566.58 |
1.0098 times |
Fri 05 September 2025 |
559.96 (-0.52%) |
555.24 |
546.41 - 561.02 |
0.772 times |
Fri 29 August 2025 |
562.88 (0%) |
557.32 |
556.89 - 562.88 |
0.2091 times |
Fri 29 August 2025 |
562.88 (0.31%) |
563.61 |
547.10 - 564.47 |
1.1408 times |
Fri 22 August 2025 |
561.14 (-1.9%) |
572.33 |
555.02 - 576.91 |
1.0594 times |
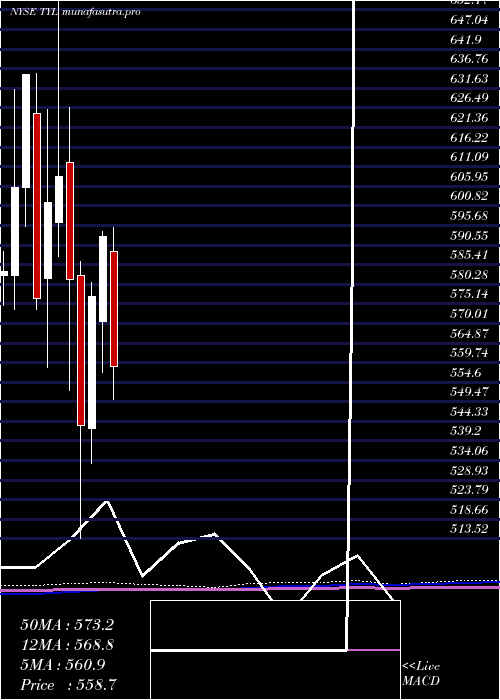
Monthly price and charts TylerTechnologies Strong monthly Stock price targets for TylerTechnologies TYL are 476.16 and 517.66 | Monthly Target 1 | 464.79 | | Monthly Target 2 | 487.52 | | Monthly Target 3 | 506.29 | | Monthly Target 4 | 529.02 | | Monthly Target 5 | 547.79 |
Monthly price and volumes Tyler Technologies
| Date |
Closing |
Open |
Range |
Volume |
Mon 20 October 2025 |
510.25 (-2.47%) |
525.06 |
483.56 - 525.06 |
0.8146 times |
Tue 30 September 2025 |
523.16 (-7.06%) |
555.24 |
516.77 - 566.58 |
1.1194 times |
Fri 29 August 2025 |
562.88 (-3.71%) |
581.60 |
547.10 - 621.34 |
1.1433 times |
Thu 31 July 2025 |
584.56 (-1.4%) |
588.84 |
548.37 - 595.21 |
1.2952 times |
Mon 30 June 2025 |
592.84 (2.75%) |
570.52 |
557.24 - 594.05 |
0.9066 times |
Fri 30 May 2025 |
576.99 (6.2%) |
542.41 |
533.14 - 580.64 |
0.8591 times |
Wed 30 April 2025 |
543.30 (-6.55%) |
582.61 |
513.52 - 586.11 |
1.1911 times |
Mon 31 March 2025 |
581.39 (-4.44%) |
612.16 |
552.27 - 626.56 |
0.9802 times |
Fri 28 February 2025 |
608.43 (1.13%) |
596.54 |
587.49 - 661.31 |
0.8345 times |
Fri 31 January 2025 |
601.64 (4.34%) |
581.69 |
558.37 - 626.08 |
0.856 times |
Tue 31 December 2024 |
576.64 (-9.22%) |
624.99 |
573.59 - 635.48 |
0.632 times |
DMA SMA EMA moving averages of Tyler Technologies TYL
DMA (daily moving average) of Tyler Technologies TYL
| DMA period | DMA value | | 5 day DMA | 504.14 | | 12 day DMA | 503.35 | | 20 day DMA | 509.74 | | 35 day DMA | 525.59 | | 50 day DMA | 537.28 | | 100 day DMA | 556.51 | | 150 day DMA | 558.41 | | 200 day DMA | 568.15 | EMA (exponential moving average) of Tyler Technologies TYL
| EMA period | EMA current | EMA prev | EMA prev2 | | 5 day EMA | 505.48 | 503.1 | 501.85 | | 12 day EMA | 506.85 | 506.23 | 506.34 | | 20 day EMA | 512.36 | 512.58 | 513.31 | | 35 day EMA | 524.94 | 525.8 | 526.99 | | 50 day EMA | 539.13 | 540.31 | 541.73 |
SMA (simple moving average) of Tyler Technologies TYL
| SMA period | SMA current | SMA prev | SMA prev2 | | 5 day SMA | 504.14 | 503.4 | 503.12 | | 12 day SMA | 503.35 | 502.34 | 501.94 | | 20 day SMA | 509.74 | 511.03 | 512.47 | | 35 day SMA | 525.59 | 527.09 | 528.73 | | 50 day SMA | 537.28 | 538.76 | 540.53 | | 100 day SMA | 556.51 | 557.17 | 557.77 | | 150 day SMA | 558.41 | 558.77 | 559.08 | | 200 day SMA | 568.15 | 568.47 | 568.82 |
|
|
