TortoiseEnergy TYG full analysis,charts,indicators,moving averages,SMA,DMA,EMA,ADX,MACD,RSITortoise Energy TYG WideScreen charts, DMA,SMA,EMA technical analysis, forecast prediction, by indicators ADX,MACD,RSI,CCI NYSE stock exchange
operates under N A sector & deals in N A
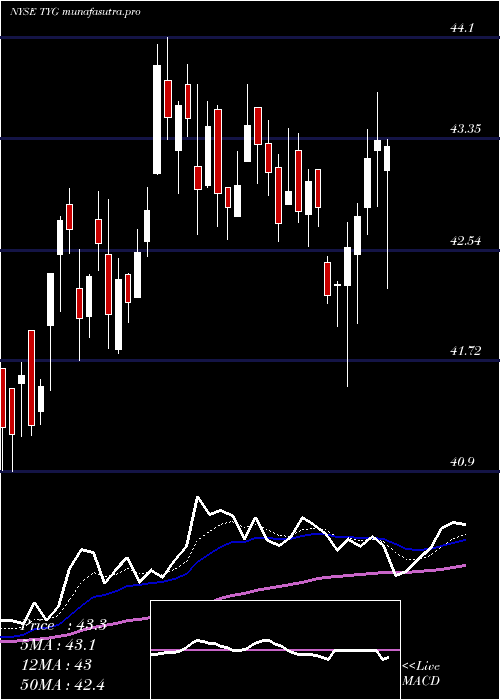
Daily price and charts and targets TortoiseEnergy Strong Daily Stock price targets for TortoiseEnergy TYG are 41.84 and 42.31 | Daily Target 1 | 41.74 | | Daily Target 2 | 41.93 | | Daily Target 3 | 42.213333333333 | | Daily Target 4 | 42.4 | | Daily Target 5 | 42.68 |
Daily price and volume Tortoise Energy
| Date |
Closing |
Open |
Range |
Volume |
Fri 17 October 2025 |
42.11 (-0.68%) |
42.35 |
42.03 - 42.50 |
1.1067 times |
Thu 16 October 2025 |
42.40 (-0.87%) |
42.88 |
42.09 - 43.30 |
1.1845 times |
Wed 15 October 2025 |
42.77 (0.59%) |
42.54 |
42.51 - 43.38 |
1.0802 times |
Tue 14 October 2025 |
42.52 (-0.54%) |
42.62 |
42.52 - 42.97 |
0.9022 times |
Mon 13 October 2025 |
42.75 (1.04%) |
42.50 |
42.50 - 43.12 |
0.9329 times |
Fri 10 October 2025 |
42.31 (-3.14%) |
43.50 |
42.20 - 43.69 |
1.3461 times |
Thu 09 October 2025 |
43.68 (-0.16%) |
43.64 |
43.53 - 44.00 |
0.9983 times |
Wed 08 October 2025 |
43.75 (0.64%) |
43.71 |
43.51 - 43.92 |
1.1497 times |
Tue 07 October 2025 |
43.47 (-0.09%) |
43.68 |
43.39 - 43.68 |
0.6567 times |
Mon 06 October 2025 |
43.51 (0.28%) |
43.46 |
43.36 - 43.68 |
0.6428 times |
Fri 03 October 2025 |
43.39 (1.05%) |
43.48 |
43.25 - 43.56 |
1.1006 times |
Weekly price and charts TortoiseEnergy Strong weekly Stock price targets for TortoiseEnergy TYG are 41.4 and 42.75 | Weekly Target 1 | 41.16 | | Weekly Target 2 | 41.63 | | Weekly Target 3 | 42.506666666667 | | Weekly Target 4 | 42.98 | | Weekly Target 5 | 43.86 |
Weekly price and volumes for Tortoise Energy
| Date |
Closing |
Open |
Range |
Volume |
Fri 17 October 2025 |
42.11 (-0.47%) |
42.50 |
42.03 - 43.38 |
0.974 times |
Fri 10 October 2025 |
42.31 (-2.49%) |
43.46 |
42.20 - 44.00 |
0.8967 times |
Fri 03 October 2025 |
43.39 (0.67%) |
43.16 |
42.85 - 43.56 |
1.0074 times |
Fri 26 September 2025 |
43.10 (1.94%) |
42.51 |
42.18 - 43.18 |
1.3413 times |
Fri 19 September 2025 |
42.28 (-0.28%) |
42.60 |
42.10 - 42.82 |
1.1198 times |
Fri 12 September 2025 |
42.40 (-0.73%) |
42.73 |
42.23 - 42.90 |
1.1247 times |
Fri 05 September 2025 |
42.71 (0.19%) |
42.00 |
42.00 - 43.23 |
0.9422 times |
Fri 29 August 2025 |
42.63 (0%) |
43.01 |
42.55 - 43.04 |
0.2384 times |
Fri 29 August 2025 |
42.63 (-0.44%) |
43.02 |
42.55 - 43.40 |
0.9671 times |
Fri 22 August 2025 |
42.82 (-0.86%) |
43.19 |
42.60 - 43.36 |
1.3884 times |
Fri 15 August 2025 |
43.19 (-1.44%) |
43.87 |
42.85 - 43.88 |
1.1921 times |
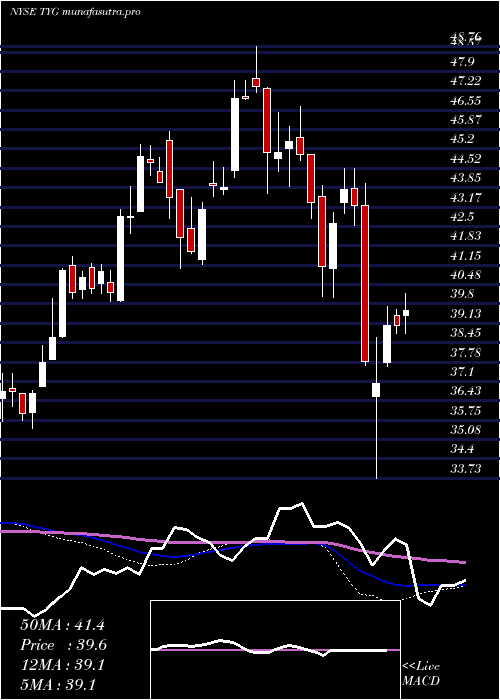
Monthly price and charts TortoiseEnergy Strong monthly Stock price targets for TortoiseEnergy TYG are 41.09 and 43.06 | Monthly Target 1 | 40.74 | | Monthly Target 2 | 41.43 | | Monthly Target 3 | 42.713333333333 | | Monthly Target 4 | 43.4 | | Monthly Target 5 | 44.68 |
Monthly price and volumes Tortoise Energy
| Date |
Closing |
Open |
Range |
Volume |
Fri 17 October 2025 |
42.11 (-2.27%) |
43.27 |
42.03 - 44.00 |
0.3901 times |
Tue 30 September 2025 |
43.09 (1.08%) |
42.00 |
42.00 - 43.38 |
0.7895 times |
Fri 29 August 2025 |
42.63 (-1.64%) |
43.12 |
42.25 - 43.97 |
0.7986 times |
Thu 31 July 2025 |
43.34 (-1.25%) |
43.78 |
41.53 - 44.10 |
1.0878 times |
Mon 30 June 2025 |
43.89 (8.37%) |
40.67 |
40.28 - 44.05 |
0.7316 times |
Fri 30 May 2025 |
40.50 (1.84%) |
39.77 |
39.14 - 41.62 |
0.7717 times |
Wed 30 April 2025 |
39.77 (-7.62%) |
43.05 |
33.73 - 43.98 |
1.2196 times |
Mon 31 March 2025 |
43.05 (-0.67%) |
43.55 |
40.04 - 44.51 |
1.1601 times |
Fri 28 February 2025 |
43.34 (-3.86%) |
44.87 |
42.77 - 46.69 |
1.178 times |
Fri 31 January 2025 |
45.08 (7.33%) |
42.10 |
41.95 - 48.76 |
1.873 times |
Tue 31 December 2024 |
42.00 (-6.12%) |
44.92 |
41.03 - 45.82 |
0.5678 times |

DMA SMA EMA moving averages of Tortoise Energy TYG
DMA (daily moving average) of Tortoise Energy TYG
| DMA period | DMA value | | 5 day DMA | 42.51 | | 12 day DMA | 42.97 | | 20 day DMA | 42.92 | | 35 day DMA | 42.73 | | 50 day DMA | 42.81 | | 100 day DMA | 42.66 | | 150 day DMA | 41.94 | | 200 day DMA | 42.56 | EMA (exponential moving average) of Tortoise Energy TYG
| EMA period | EMA current | EMA prev | EMA prev2 | | 5 day EMA | 42.49 | 42.68 | 42.82 | | 12 day EMA | 42.74 | 42.86 | 42.94 | | 20 day EMA | 42.81 | 42.88 | 42.93 | | 35 day EMA | 42.87 | 42.92 | 42.95 | | 50 day EMA | 42.83 | 42.86 | 42.88 |
SMA (simple moving average) of Tortoise Energy TYG
| SMA period | SMA current | SMA prev | SMA prev2 | | 5 day SMA | 42.51 | 42.55 | 42.81 | | 12 day SMA | 42.97 | 43.07 | 43.12 | | 20 day SMA | 42.92 | 42.92 | 42.93 | | 35 day SMA | 42.73 | 42.75 | 42.76 | | 50 day SMA | 42.81 | 42.84 | 42.86 | | 100 day SMA | 42.66 | 42.65 | 42.63 | | 150 day SMA | 41.94 | 41.93 | 41.92 | | 200 day SMA | 42.56 | 42.56 | 42.56 |
|
|
