TriContinental TY full analysis,charts,indicators,moving averages,SMA,DMA,EMA,ADX,MACD,RSITri Continental TY WideScreen charts, DMA,SMA,EMA technical analysis, forecast prediction, by indicators ADX,MACD,RSI,CCI NYSE stock exchange
operates under N A sector & deals in N A
Daily price and charts and targets TriContinental Strong Daily Stock price targets for TriContinental TY are 34.36 and 34.66 | Daily Target 1 | 34.28 | | Daily Target 2 | 34.44 | | Daily Target 3 | 34.583333333333 | | Daily Target 4 | 34.74 | | Daily Target 5 | 34.88 |
Daily price and volume Tri Continental
| Date |
Closing |
Open |
Range |
Volume |
Thu 04 December 2025 |
34.59 (0.06%) |
34.62 |
34.43 - 34.73 |
0.9773 times |
Wed 03 December 2025 |
34.57 (0.46%) |
34.41 |
34.17 - 34.64 |
1.2327 times |
Tue 02 December 2025 |
34.41 (0%) |
34.44 |
34.28 - 34.56 |
0.9899 times |
Mon 01 December 2025 |
34.41 (0.2%) |
34.40 |
34.15 - 34.67 |
0.9489 times |
Fri 28 November 2025 |
34.34 (0.12%) |
34.30 |
34.22 - 34.78 |
0.6021 times |
Wed 26 November 2025 |
34.30 (-0.03%) |
34.38 |
34.28 - 34.69 |
0.7598 times |
Tue 25 November 2025 |
34.31 (1.03%) |
33.98 |
33.98 - 34.44 |
0.9773 times |
Mon 24 November 2025 |
33.96 (1.22%) |
33.67 |
33.34 - 34.11 |
1.2768 times |
Fri 21 November 2025 |
33.55 (0.21%) |
33.53 |
33.20 - 34.04 |
1.5668 times |
Thu 20 November 2025 |
33.48 (-0.89%) |
33.87 |
33.33 - 34.26 |
0.6683 times |
Wed 19 November 2025 |
33.78 (0.87%) |
33.49 |
33.16 - 33.99 |
2.5221 times |
Weekly price and charts TriContinental Strong weekly Stock price targets for TriContinental TY are 34.37 and 34.95 | Weekly Target 1 | 33.91 | | Weekly Target 2 | 34.25 | | Weekly Target 3 | 34.49 | | Weekly Target 4 | 34.83 | | Weekly Target 5 | 35.07 |
Weekly price and volumes for Tri Continental
| Date |
Closing |
Open |
Range |
Volume |
Thu 04 December 2025 |
34.59 (0.73%) |
34.40 |
34.15 - 34.73 |
0.8438 times |
Fri 28 November 2025 |
34.34 (2.35%) |
33.67 |
33.34 - 34.78 |
0.7355 times |
Fri 21 November 2025 |
33.55 (-1.5%) |
33.98 |
33.16 - 34.26 |
1.3363 times |
Fri 14 November 2025 |
34.06 (0.95%) |
33.92 |
33.64 - 34.80 |
0.815 times |
Fri 07 November 2025 |
33.74 (-1.98%) |
33.96 |
33.21 - 34.19 |
1.3408 times |
Fri 31 October 2025 |
34.42 (0%) |
34.57 |
34.30 - 34.80 |
0.1847 times |
Fri 31 October 2025 |
34.42 (0.67%) |
34.40 |
34.00 - 34.84 |
1.3632 times |
Fri 24 October 2025 |
34.19 (1.42%) |
33.80 |
33.72 - 34.33 |
0.999 times |
Fri 17 October 2025 |
33.71 (0.3%) |
33.83 |
33.44 - 34.39 |
0.956 times |
Fri 10 October 2025 |
33.61 (-2.01%) |
34.23 |
33.52 - 34.74 |
1.4257 times |
Fri 03 October 2025 |
34.30 (1.48%) |
33.88 |
33.67 - 34.30 |
0.8832 times |
Monthly price and charts TriContinental Strong monthly Stock price targets for TriContinental TY are 34.37 and 34.95 | Monthly Target 1 | 33.91 | | Monthly Target 2 | 34.25 | | Monthly Target 3 | 34.49 | | Monthly Target 4 | 34.83 | | Monthly Target 5 | 35.07 |
Monthly price and volumes Tri Continental
| Date |
Closing |
Open |
Range |
Volume |
Thu 04 December 2025 |
34.59 (0.73%) |
34.40 |
34.15 - 34.73 |
0.1608 times |
Fri 28 November 2025 |
34.34 (-0.23%) |
33.96 |
33.16 - 34.80 |
0.8056 times |
Fri 31 October 2025 |
34.42 (1.24%) |
34.00 |
33.44 - 34.84 |
1.0286 times |
Tue 30 September 2025 |
34.00 (1.37%) |
33.40 |
33.18 - 34.38 |
1.0264 times |
Fri 29 August 2025 |
33.54 (2.63%) |
32.53 |
32.03 - 33.77 |
1.1 times |
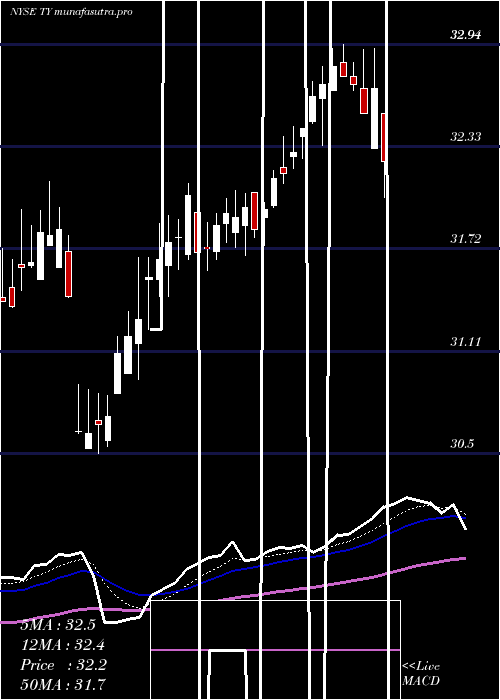
Thu 31 July 2025 |
32.68 (3.22%) |
31.62 |
31.44 - 32.94 |
1.2949 times |
Mon 30 June 2025 |
31.66 (1.51%) |
31.18 |
30.50 - 32.12 |
1.0358 times |
Fri 30 May 2025 |
31.19 (4.77%) |
30.00 |
29.90 - 31.79 |
0.957 times |
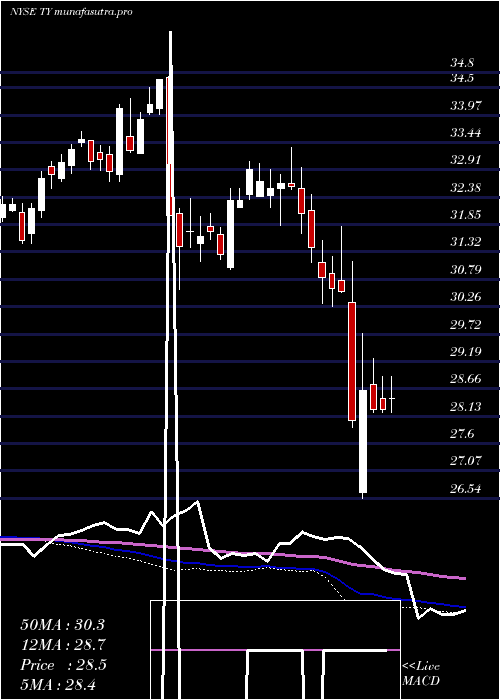
Wed 30 April 2025 |
29.77 (-2.93%) |
30.60 |
26.54 - 31.13 |
1.6188 times |
Mon 31 March 2025 |
30.67 (-4.34%) |
32.12 |
30.15 - 32.44 |
0.9722 times |
Fri 28 February 2025 |
32.06 (-1.9%) |
32.41 |
31.68 - 33.35 |
1.2183 times |

DMA SMA EMA moving averages of Tri Continental TY
DMA (daily moving average) of Tri Continental TY
| DMA period | DMA value | | 5 day DMA | 34.46 | | 12 day DMA | 34.1 | | 20 day DMA | 34.08 | | 35 day DMA | 34.12 | | 50 day DMA | 34.08 | | 100 day DMA | 33.63 | | 150 day DMA | 32.82 | | 200 day DMA | 32.19 | EMA (exponential moving average) of Tri Continental TY
| EMA period | EMA current | EMA prev | EMA prev2 | | 5 day EMA | 34.46 | 34.39 | 34.3 | | 12 day EMA | 34.27 | 34.21 | 34.15 | | 20 day EMA | 34.18 | 34.14 | 34.1 | | 35 day EMA | 34.12 | 34.09 | 34.06 | | 50 day EMA | 34.09 | 34.07 | 34.05 |
SMA (simple moving average) of Tri Continental TY
| SMA period | SMA current | SMA prev | SMA prev2 | | 5 day SMA | 34.46 | 34.41 | 34.35 | | 12 day SMA | 34.1 | 34.03 | 33.99 | | 20 day SMA | 34.08 | 34.06 | 34.03 | | 35 day SMA | 34.12 | 34.1 | 34.08 | | 50 day SMA | 34.08 | 34.06 | 34.06 | | 100 day SMA | 33.63 | 33.6 | 33.57 | | 150 day SMA | 32.82 | 32.79 | 32.76 | | 200 day SMA | 32.19 | 32.18 | 32.17 |
|
|
