TwilioInc TWLO full analysis,charts,indicators,moving averages,SMA,DMA,EMA,ADX,MACD,RSITwilio Inc TWLO WideScreen charts, DMA,SMA,EMA technical analysis, forecast prediction, by indicators ADX,MACD,RSI,CCI NYSE stock exchange
operates under Technology sector & deals in Computer Software Prepackaged Software
Daily price and charts and targets TwilioInc Strong Daily Stock price targets for TwilioInc TWLO are 108.1 and 111.63 | Daily Target 1 | 105.43 | | Daily Target 2 | 107.23 | | Daily Target 3 | 108.96333333333 | | Daily Target 4 | 110.76 | | Daily Target 5 | 112.49 |
Daily price and volume Twilio Inc
| Date |
Closing |
Open |
Range |
Volume |
Mon 20 October 2025 |
109.02 (2.22%) |
107.96 |
107.17 - 110.70 |
0.6889 times |
Fri 17 October 2025 |
106.65 (1.25%) |
104.92 |
104.50 - 108.00 |
0.7071 times |
Thu 16 October 2025 |
105.33 (-2.35%) |
107.86 |
105.33 - 111.69 |
0.7224 times |
Wed 15 October 2025 |
107.86 (-0.22%) |
109.12 |
106.39 - 109.56 |
1.0325 times |
Tue 14 October 2025 |
108.10 (-2.2%) |
108.51 |
105.71 - 109.22 |
0.8813 times |
Mon 13 October 2025 |
110.53 (3.18%) |
109.00 |
107.66 - 110.80 |
0.5847 times |
Fri 10 October 2025 |
107.12 (-6%) |
114.91 |
107.04 - 115.75 |
1.2254 times |
Thu 09 October 2025 |
113.96 (-0.08%) |
113.77 |
112.48 - 115.33 |
0.9891 times |
Wed 08 October 2025 |
114.05 (6.04%) |
108.80 |
108.23 - 114.22 |
1.8241 times |
Tue 07 October 2025 |
107.55 (-2.23%) |
110.00 |
104.98 - 110.80 |
1.3445 times |
Mon 06 October 2025 |
110.00 (7.19%) |
103.22 |
102.88 - 110.49 |
1.5538 times |
Weekly price and charts TwilioInc Strong weekly Stock price targets for TwilioInc TWLO are 108.1 and 111.63 | Weekly Target 1 | 105.43 | | Weekly Target 2 | 107.23 | | Weekly Target 3 | 108.96333333333 | | Weekly Target 4 | 110.76 | | Weekly Target 5 | 112.49 |
Weekly price and volumes for Twilio Inc
| Date |
Closing |
Open |
Range |
Volume |
Mon 20 October 2025 |
109.02 (2.22%) |
107.96 |
107.17 - 110.70 |
0.1342 times |
Fri 17 October 2025 |
106.65 (-0.44%) |
109.00 |
104.50 - 111.69 |
0.7655 times |
Fri 10 October 2025 |
107.12 (4.39%) |
103.22 |
102.88 - 115.75 |
1.3519 times |
Fri 03 October 2025 |
102.62 (0.27%) |
103.36 |
98.44 - 105.77 |
1.4874 times |
Fri 26 September 2025 |
102.34 (-3.91%) |
105.78 |
100.77 - 106.18 |
1.0869 times |
Fri 19 September 2025 |
106.50 (4.08%) |
103.44 |
100.70 - 108.60 |
1.668 times |
Fri 12 September 2025 |
102.33 (-5.83%) |
109.21 |
100.89 - 110.19 |
1.2801 times |
Fri 05 September 2025 |
108.67 (2.9%) |
102.72 |
101.81 - 111.25 |
0.7655 times |
Fri 29 August 2025 |
105.61 (0%) |
106.55 |
104.78 - 107.41 |
0.2181 times |
Fri 29 August 2025 |
105.61 (-0.72%) |
105.89 |
102.04 - 107.41 |
1.2423 times |
Fri 22 August 2025 |
106.38 (0.67%) |
104.82 |
98.93 - 107.83 |
4.0059 times |
Monthly price and charts TwilioInc Strong monthly Stock price targets for TwilioInc TWLO are 104.13 and 120.65 | Monthly Target 1 | 91.48 | | Monthly Target 2 | 100.25 | | Monthly Target 3 | 108 | | Monthly Target 4 | 116.77 | | Monthly Target 5 | 124.52 |
Monthly price and volumes Twilio Inc
| Date |
Closing |
Open |
Range |
Volume |
Mon 20 October 2025 |
109.02 (8.92%) |
101.31 |
99.23 - 115.75 |
0.5197 times |
Tue 30 September 2025 |
100.09 (-5.23%) |
102.72 |
98.44 - 111.25 |
0.8899 times |
Fri 29 August 2025 |
105.61 (-18.13%) |
126.08 |
91.84 - 132.39 |
1.9791 times |
Thu 31 July 2025 |
129.00 (3.73%) |
124.56 |
112.11 - 135.40 |
0.8931 times |
Mon 30 June 2025 |
124.36 (5.66%) |
117.60 |
112.32 - 125.52 |
0.6155 times |
Fri 30 May 2025 |
117.70 (21.7%) |
99.00 |
97.00 - 119.52 |
1.0328 times |
Wed 30 April 2025 |
96.71 (-1.23%) |
98.09 |
77.51 - 101.40 |
0.7889 times |
Mon 31 March 2025 |
97.91 (-18.36%) |
119.98 |
94.13 - 121.47 |
0.765 times |
Fri 28 February 2025 |
119.93 (-18.18%) |
142.54 |
111.74 - 149.19 |
1.1995 times |
Fri 31 January 2025 |
146.58 (35.62%) |
109.55 |
105.53 - 151.95 |
1.3165 times |
Tue 31 December 2024 |
108.08 (3.51%) |
108.55 |
103.78 - 116.43 |
0.6731 times |

DMA SMA EMA moving averages of Twilio Inc TWLO
DMA (daily moving average) of Twilio Inc TWLO
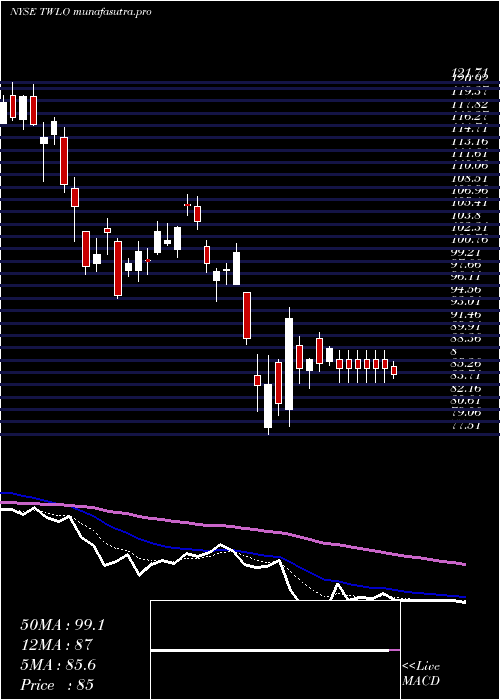
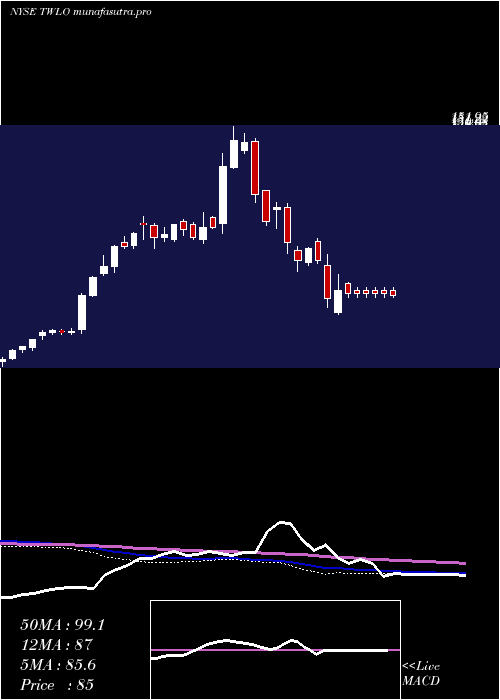
| DMA period | DMA value | | 5 day DMA | 107.39 | | 12 day DMA | 108.57 | | 20 day DMA | 106.28 | | 35 day DMA | 105.86 | | 50 day DMA | 105.08 | | 100 day DMA | 113.14 | | 150 day DMA | 108.2 | | 200 day DMA | 111.52 | EMA (exponential moving average) of Twilio Inc TWLO
| EMA period | EMA current | EMA prev | EMA prev2 | | 5 day EMA | 107.87 | 107.3 | 107.62 | | 12 day EMA | 107.65 | 107.4 | 107.54 | | 20 day EMA | 107.09 | 106.89 | 106.91 | | 35 day EMA | 106.55 | 106.4 | 106.38 | | 50 day EMA | 106.01 | 105.89 | 105.86 |
SMA (simple moving average) of Twilio Inc TWLO
| SMA period | SMA current | SMA prev | SMA prev2 | | 5 day SMA | 107.39 | 107.69 | 107.79 | | 12 day SMA | 108.57 | 108.27 | 107.94 | | 20 day SMA | 106.28 | 106.09 | 106.08 | | 35 day SMA | 105.86 | 105.76 | 105.73 | | 50 day SMA | 105.08 | 104.75 | 104.59 | | 100 day SMA | 113.14 | 113.22 | 113.28 | | 150 day SMA | 108.2 | 108.13 | 108.09 | | 200 day SMA | 111.52 | 111.54 | 111.57 |
|
|
